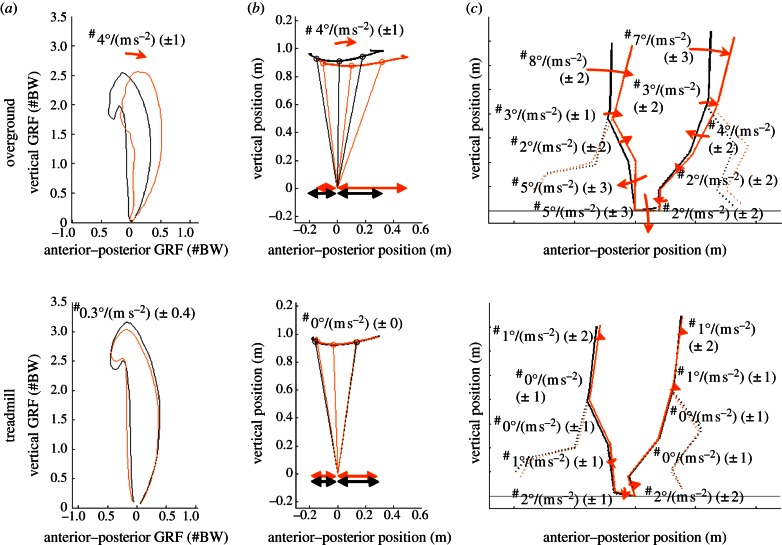
Figure 2.
(a) Ground reaction force butterfly representations, (b) Body lean (1–25–50–75–100% stance) and distance between BCOM and COP application at initial contact and toe-off (arrows) and (c) segment orientations when running at steady state (black) and accelerating (1.7 m s−2, grey; orange in online version) overground (top panels) and on accelerating treadmill (bottom panels), both at 3.7 m s−1. Arrows indicate the changes in the variable per rise in acceleration of 1 m s−2. Hash symbol indicates a significant difference between the acceleration effect overground and on the treadmill. Figures are the mean of four representative subjects; arrows and numbers indicate the acceleration effects (corrected for speed) for all 10 subjects. (Online version in colour.)

