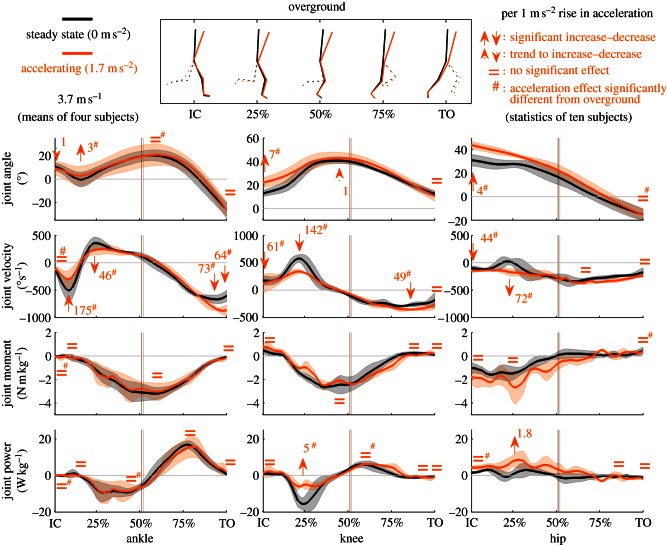
Figure 3.
Joint kinematics and kinetics of the stance leg when accelerating overground. Mean of four subjects running at 3.7 m s−1 steady state (black) and accelerating at 1.7 m s−2 (grey; orange in online version). Flexion is positive, extension is negative. Power generation is positive, power absorption is negative. Bands around the means represent 1 s.d. Full arrows indicate significant acceleration effects (p < 0.05), dotted arrows indicate trends (p < 0.1) and = indicates no significant acceleration effect (all corrected for the covariate speed) for all 10 subjects. Numbers next to the arrows indicate the magnitude of the effect per rise in acceleration of 1 m s−2. Vertical lines indicate instants of zero-crossing, i.e. the transition from braking to accelerating. Hash symbol indicates the acceleration effect retrieved is significantly different from the acceleration effect on the treadmill (p < 0.05). (Online version in colour.)

