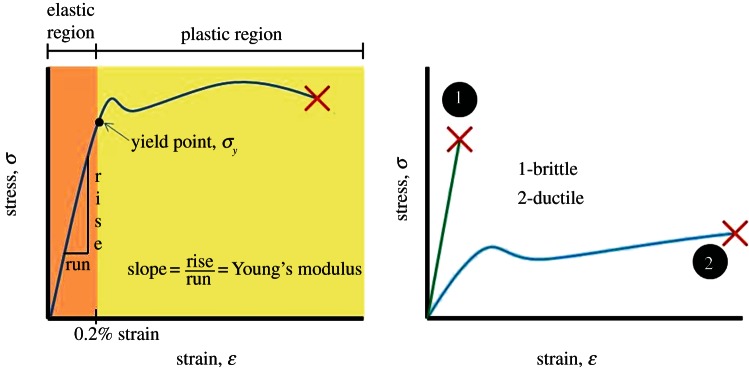
Figure 1.

Tension tests allow the user to calculate both the stress and strain of the material at any given point in time up to fracture (denoted by X). A stress–strain plot can be obtained by plotting stress on the y-axis and strain on the x-axis and can used to calculate several material properties of the specimen being tested. For example, the slope of the stress–strain curve in the linear, elastic region is Young's modulus. The elastic region of the stress–strain curve ends at the yielding point, which usually occurs after 0.2% strain. Brittle materials tend to fracture soon after the yielding point while ductile materials continue to deform in the plastic region until fracture occurs. (Online version in colour.)
