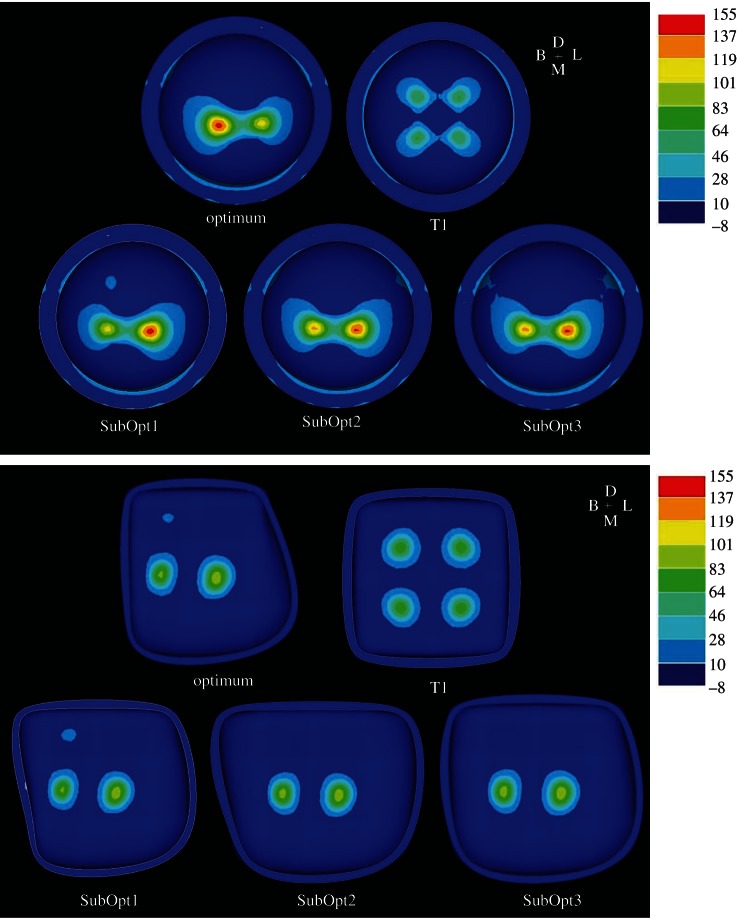
Figure 8.
Tensile stress distributions for the most optimal (upper left), least optimal (upper right), and suboptimal (bottom) teeth. The top contour plots are the tensile stress distributions on the underside of the food item, and the bottom are the tensile stress distributions along the EDJ. These are the stress distributions at a 2 kN bite force.

