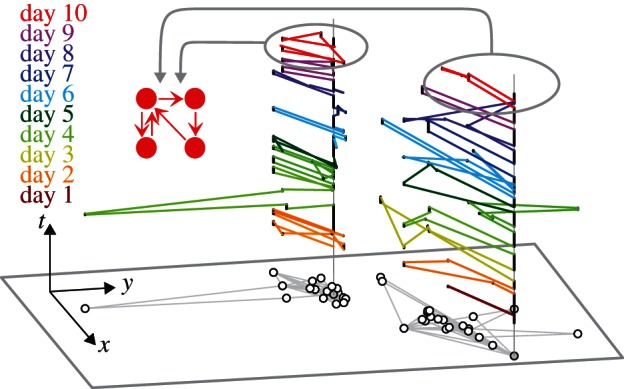
Figure 1.

Decomposition of the mobility profile over 10 days into daily mobility patterns for two anonymous mobile phone users. The home location of each user is highlighted and connected over the entire observation period with a grey line. While the entire mobility profiles (black circles and grey lines in the xy-plane) are rather diverse, the individual daily profiles (brown to red from bottom to top for different days) share common features. The aggregated networks consist of N = 16 (22) nodes and M = 37 (43) edges with an average degree of  . By contrast, the daily average number of nodes is
  , and the average number of edges is
  . The left user prefers commuting to one place and visits the other locations during a single tour, whereas the right user prefers to visit the daily locations during a single tour. On the last day, both users visit not only four locations, but also share the same daily profile consisting of two tours with one and two destinations, respectively.
