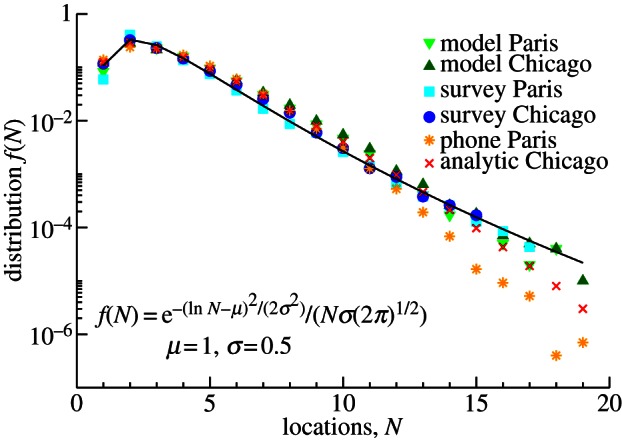
Figure 2.

Daily human mobility patterns seem to follow a universal law. The daily number of visited locations can be approximated with a log-normal distribution  with μ = 1 and σ = 0.5. The distributions extracted from activity and travel surveys as well as from mobile phone billing data show similar behaviour. Moreover, the distributions of our perturbation model (see §3 and figure 6 for details) generated both analytically and numerically have the same shape. The broad distribution shows that although most of the people visit less than five locations, a small fraction behave significantly differently because people report visits up to 17 different places within a day in our surveys. Note that due to the mobile phone data limitations, the tail of the corresponding distribution is below the other datasets.
