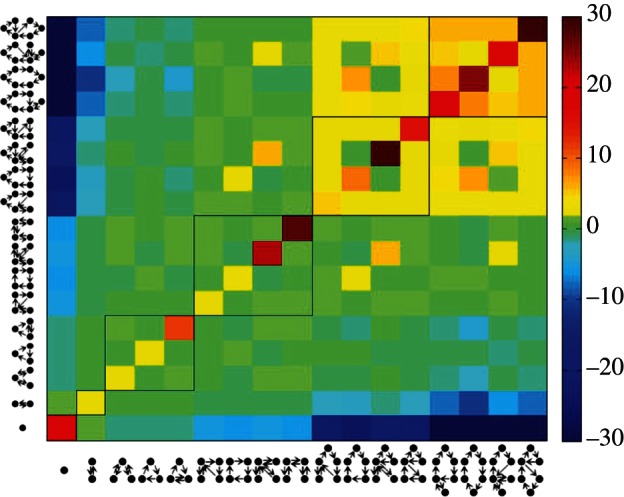
Figure 4.

Daily human mobility patterns are stable over several months. The values, calculated by equation (2.3), show how more or less likely a motif is found during the observation period of six months under the condition that the individual has a given motif on another day. Positive values (yellow to red colours) indicate that these motifs are more likely than expected and negative values (cyan to blue colours) that these motifs are suppressed. The probability to find the same daily motif during another day is significantly larger compared with the randomized dataset. Additionally, active users, which visit more than four locations per day, seem to be active over time, whereas inactive users remain inactive. The emerging patterns of transitions between active motifs could be explained by the similarity of motifs. While transitions between motifs of group II are preferred, transitions between groups II and III are suppressed, because the number of tours is most different. As a guide to the eye, motifs with the same number of locations are marked with boxes.
