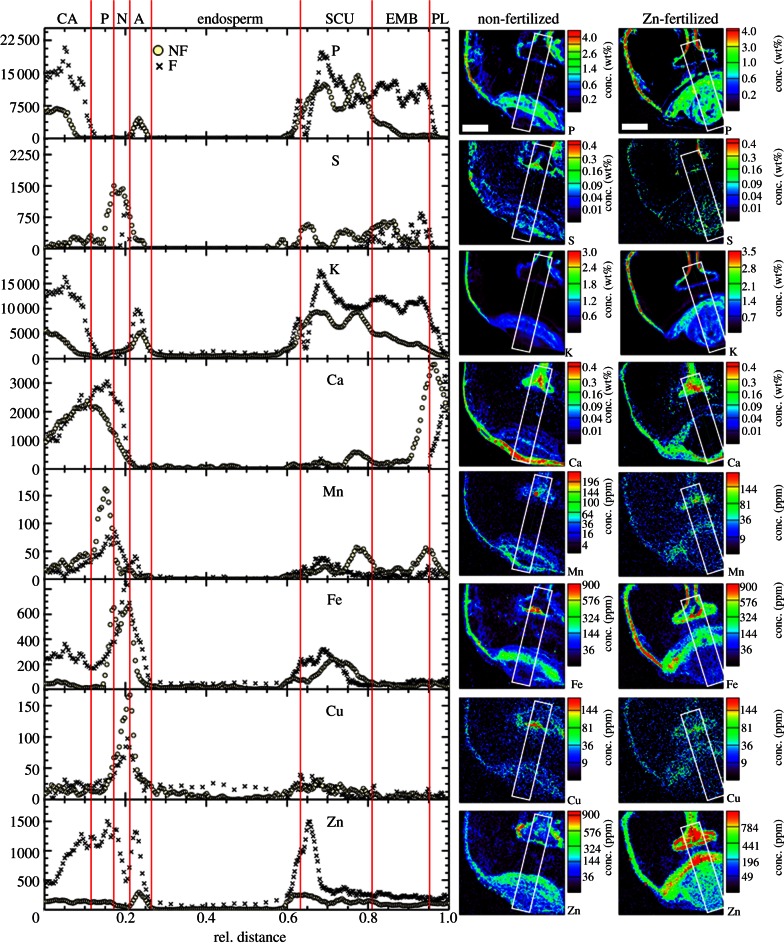
Figure 2.
Element distribution profiles and micro-PIXE quantitative element maps from grain cross sections of wheat grown in non-fertilized (circles) and Zn-fertilized (crosses) soils. Representative maps are shown. A, aleurone; CA, crease aleurone; EMB, embryo; N, nucellar projection; P, pigment strand; PL, peripheral layers; SCU, scutellum. Scan size, 2000 × 2000 µm. Scale bars, 500 µm.

