
Figure 3.
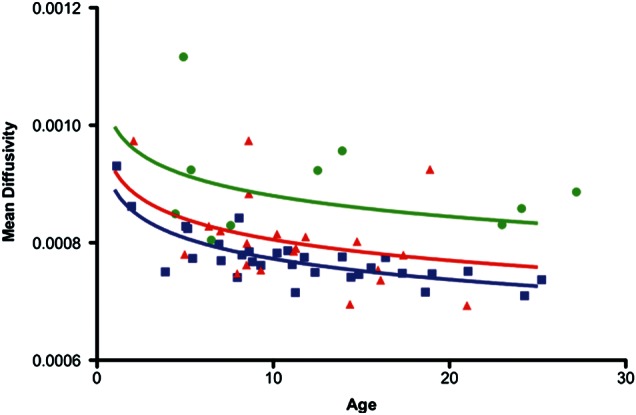
The long segment MD progression by age. Controls (blue) have a lower MD at all ages than patients without ASD (red), and patients with ASD (green). Controls have a lower MD than patients without ASD, although the difference is small (P = 0.026). Controls have a much lower MD than patients with ASD (P < 0.000001). Patients without ASD also have a much lower MD than those with ASD (P = 0.0005).