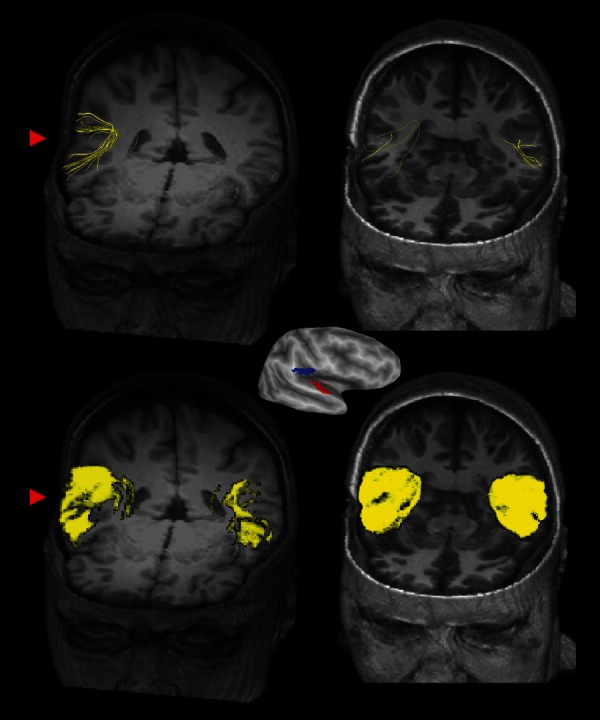
Figure 1.

Center: Lateral view of an inflated right hemisphere (dark gray shows sulcal depths, light gray shows gyral crowns) showing ROIs used for tractography (primary auditory cortex, A1, in red; secondary somatosensory cortex, OP1/S2, in blue). Top row: Deterministic tractography results in SR (left, volume rendering with axial cutout at z = 1, coronal cutout at y = 45) and a gender- and age-matched representative control subject (right, axial cutout at z = −11, coronal cutout at y = 31). Individual yellow streamlines show the location of fiber tracts between A1 and OP1/S2. The red arrowhead highlights the more extensive connections between A1 and OP1/S2 in the patient's lesioned right hemisphere when compared with her contralesional hemisphere. Bottom row: Probabilistic tractography results in SR (left) and control subject (right). Yellow regions show volume rendering of individual voxels with an above threshold probability of connections between seed regions A1 and OP1/S2. The red arrowhead highlights the large number of connected voxels in SR's right hemisphere. Note the similar asymmetry between the lesioned and non-lesioned hemisphere in SR but not the control subject for both deterministic and probabilistic analyses.
