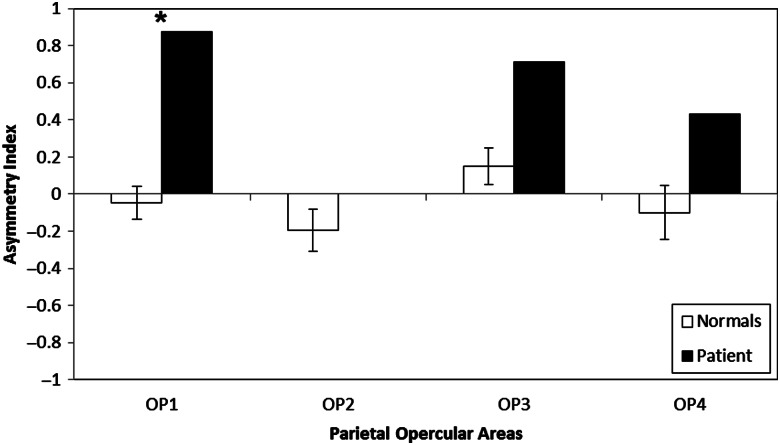
Figure 2.
Connection asymmetry from deterministic tractography between A1 and each of the four parietal opercular areas for control subjects (open bars) and patient SR (filled bars). Error bars for the control subjects represent 1 standard error of the mean, and asterisk denotes a significant difference between patient SR and the controls at P < 0.05.

