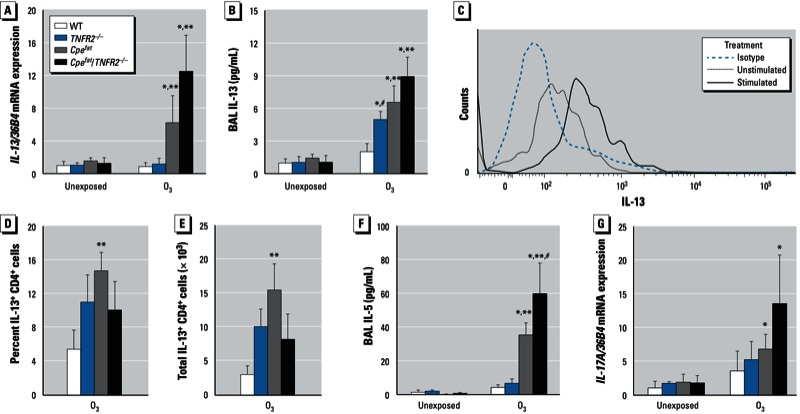
Figure 3.

IL-13 mRNA expression in lungs (A) and IL-13 concentration in BAL (B) from mice that were either unexposed or exposed to O3. Example of flow cytometry data from one Cpefat mouse (C) showing histograms of CD4+ lung cells stained with isotype control antibody or stained with anti–IL-13 and either unstimulated or stimulated with PMA (10 ng/mL) and ionomycin (500 ng/mL) for 5 hr to induce cytokine expression. Shown also are the percentages (D) and total number (E) of PMA and ionomycin stimulated CD4+ cells isolated from lungs of O3-exposed mice that expressed IL-13. BAL IL-5 concentrations (F) and IL-17A mRNA expression (G) in unexposed and O3-exposed mice. Values shown are mean ± SE of data from 4–8 mice per group. Results for IL-13 and IL-17A mRNA are normalized to 36B4 expression. *p < 0.05, compared with unexposed genotype-matched mice. **p < 0.05, compared with TNFR2 genotype-matched lean mice with the same exposure. #p < 0.05, compared with obesity-matched TNFR2-sufficient mice with the same O3 exposure.
