
Figure 6.
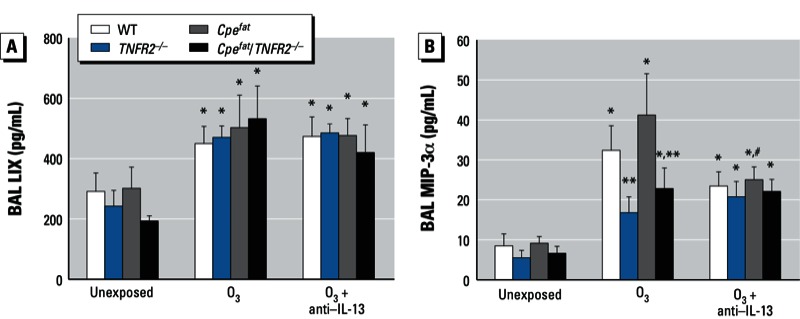
BAL LIX (A) and MIP-3α (B) from mice that were unexposed, exposed to O3, or treated with anti–IL-13 24 hr before O3 exposure. Values shown are mean ± SE of data from 5–8 mice per group. *p < 0.05, compared with unexposed genotype-matched mice. **p < 0.05, compared with obesity-matched TNFR2-sufficient mice with the same O3 exposure. #p < 0.05, compared with O3-exposed genotype-matched mice not treated with anti–IL-13.