
Fig. 1.
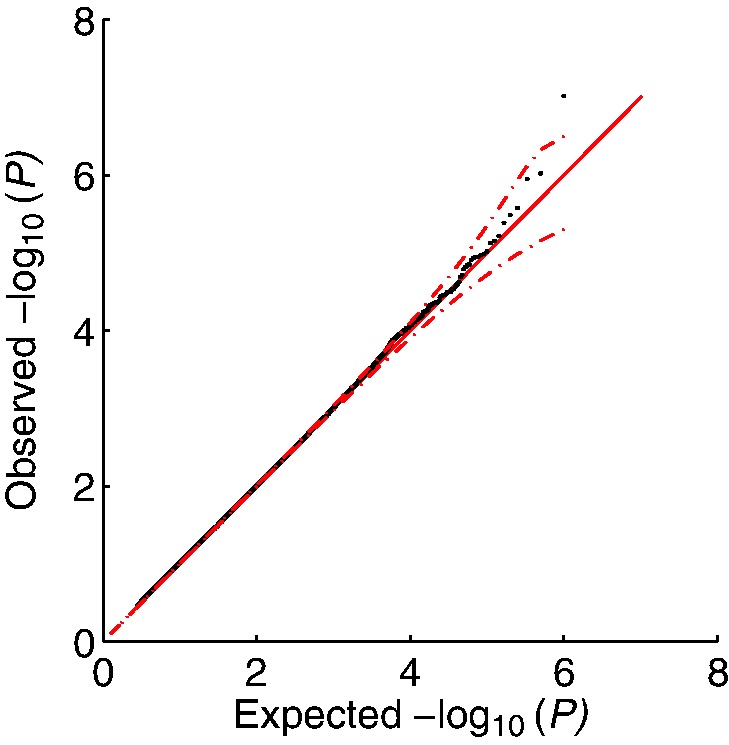
Quantile–quantile plot of observed and expected log10
P-values on the null-only WTCCC datasets (same data as used for Table 1) for FaST-LMM-Set. Dashed red error bars denote the 99% confidence interval around the solid red diagonal. Points shown are for null-only data (generated by permuting individuals in the SNPs to be tested—see Section 2) and only for the non-unity P-values (those assumed to belong to the non-zero degree of freedom component of the null distribution). The portion of the expected distribution of P-values shown is uniform on the interval [ ,1], where
  is the estimated mixing weight in the null distribution