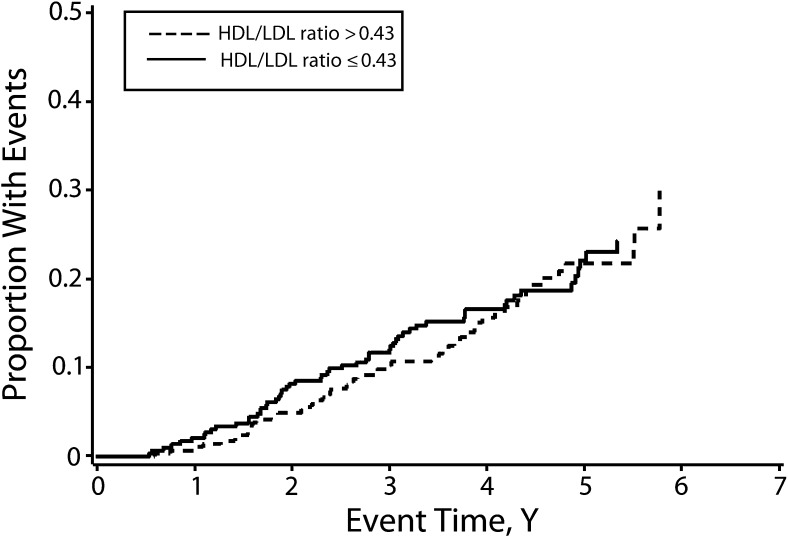
FIGURE 3—
Kaplan–Meier analysis for all-cause mortality in the overall cohort (n = 1277): the Iron and Atherosclerosis Study (FeAST), Multiple US Veterans Administration Centers, 1999–2005.
Note. HDL = high-density lipoprotein; LDL = low-density lipoprotein. There was no difference between patients having mean follow-up HDL/LDL ratios above vs below the median of the means for the cohort (hazard ratio = 0.97; 95% confidence interval = 0.66, 1.41; P = .857).

