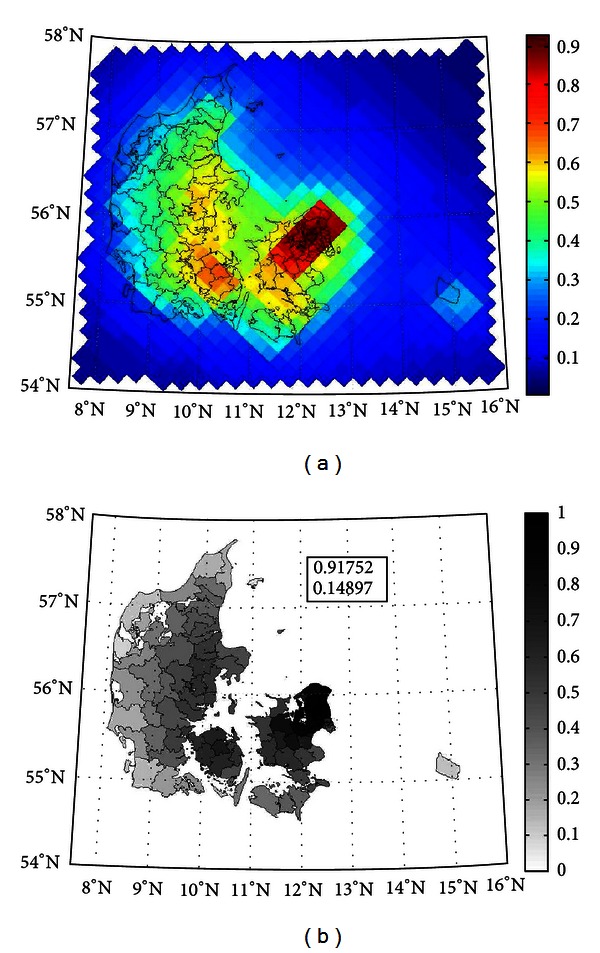
Figure 2.

DEHM-modeled yearly average ambient PM2.5 from Danish sources at (a) grid and (b) municipal level in 2005. The scales in both plots are relative, and the absolute values for minimum and maximum (in μg/m3) are in the box in the municipal plot.
