. 2013 Jun 4;2:e00523. doi: 10.7554/eLife.00523

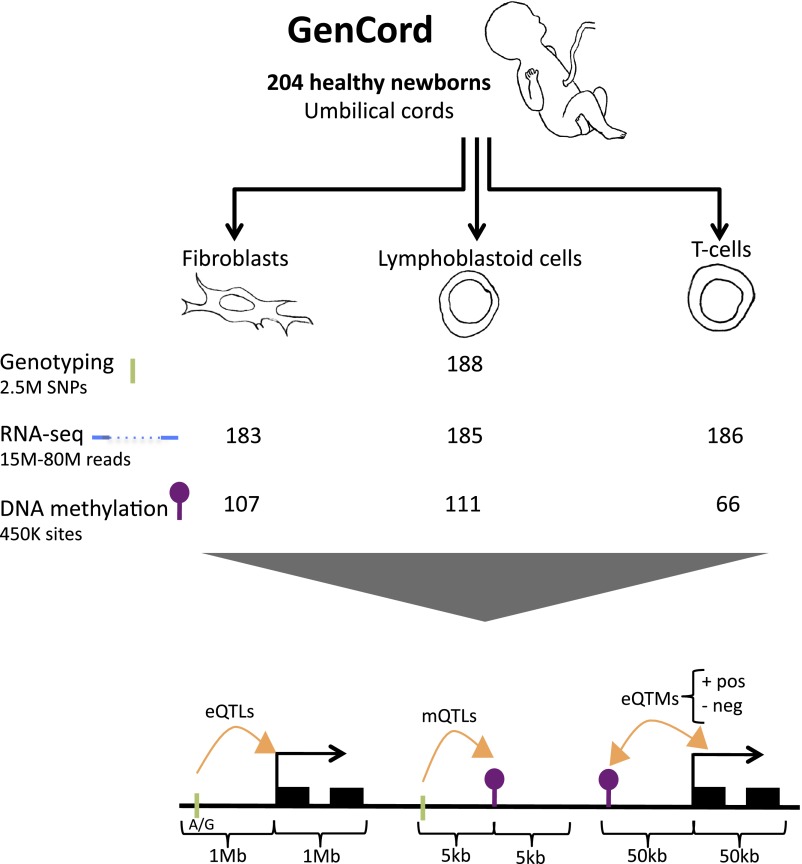
Figure 1. GenCord project scheme.

We collected umbilical cord and cord blood samples from 204 newborn babies, from which we derived three cell-types: fibroblasts, lymphoblastoid cells and T-cells. Genotyping, RNA-sequencing and DNA methylation levels were assayed. The number of samples without genetic and technical outliers is indicated for each assay and each cell-type. We then correlated and utilized different properties of all datasets in order to assess: expression Quantitative Trait Loci (eQTLs), methylation QTLs (mQTLs), positive (pos) and negative (neg) expression Quantitative Trait Methylation (eQTMs). Green ticks represent Single Nucleotide Polymorphisms (SNPs), purple lollipops represent methylation sites, black boxes represent exons and orange arrows depict associations between two data-types. Shown are the maximum distances between each pair of variables tested. See Figure 1—figure supplement 1–7 for data processing and quality checks.

DOI: http://dx.doi.org/10.7554/eLife.00523.003

Figure 1.

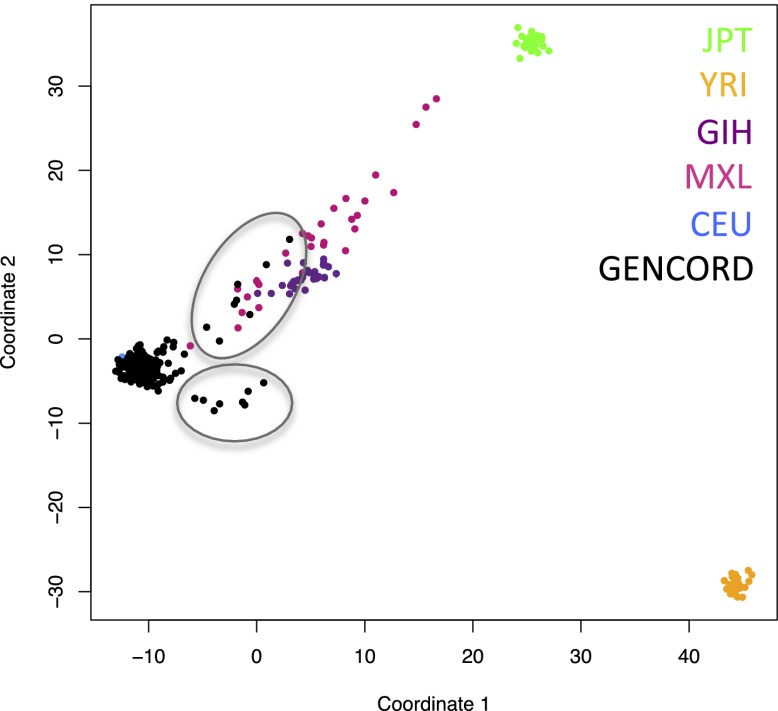
Figure 1—figure supplement 1. Genetic outliers removed from analyses involving genetic variation.

Figure 1—figure supplement 1.

Multidimensional scaling (MDS) plot showing the genetic clustering of our 204 GenCord individuals (in black) and 30 individuals from each of the following HapMap populations: Western and Northern European in Utah (CEU, in blue), Japanese in Tokyo (JPT, in green), Yoruba in Ibadan, Nigeria (YRI, in orange), Gujarati Indians in Houston (GIH, in purple), Mexican ancestry in Los Angeles (MXL, in pink). The 16 GenCord individuals inside gray circles were considered genotypic outliers and were not included in analyses involving genetic variation.
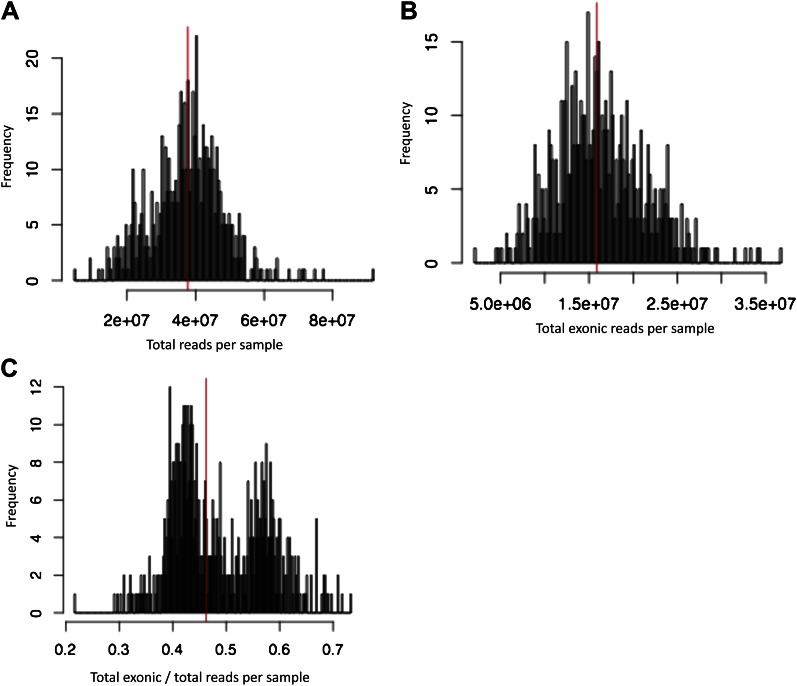
Figure 1—figure supplement 2. Number of reads per sample, before removing technical outliers.

Figure 1—figure supplement 2.

(A) Number of total reads per sample. (B) Number of total reads mapping uniquely, properly paired and with MAPQ ≥ 10 to exons. (C) Proportion of reads mapping to exons. Vertical red lines indicate median. Samples with less than 5M exonic reads were considered technical outliers.
Figure 1—figure supplement 3. Covariates for which expression data was corrected.

Figure 1—figure supplement 3.

(A) Histogram of mean GC content per library before removing outliers. (B) Histogram of insert size mode per library before removing outliers. The two samples in the extreme left were considered technical outliers and were removed. (C)–(F) p value distributions, with π1 indicated in each plot, of the linear regression effects of the four covariates we later corrected for on scaled exon levels.
Figure 1—figure supplement 4. Pair wise correlations among individuals before and after covariate correction.

Figure 1—figure supplement 4.

(A) Histograms of scaled exon counts pair wise spearman correlation coefficients between samples (all libraries scaled to 10M reads) in fibroblasts (F), LCLs (L) and T-cells (T). (B) Histogram of pair wise spearman correlation coefficients of expression levels after covariate correction between individuals in each cell-type.
Figure 1—figure supplement 5. Normalized β-value and variance across individuals.

Figure 1—figure supplement 5.

(A) Normalized beta-value distribution in fibroblasts (F), LCLs (L) and T-cells (T). (B) Distribution of normalized β-value variance per site across individuals.
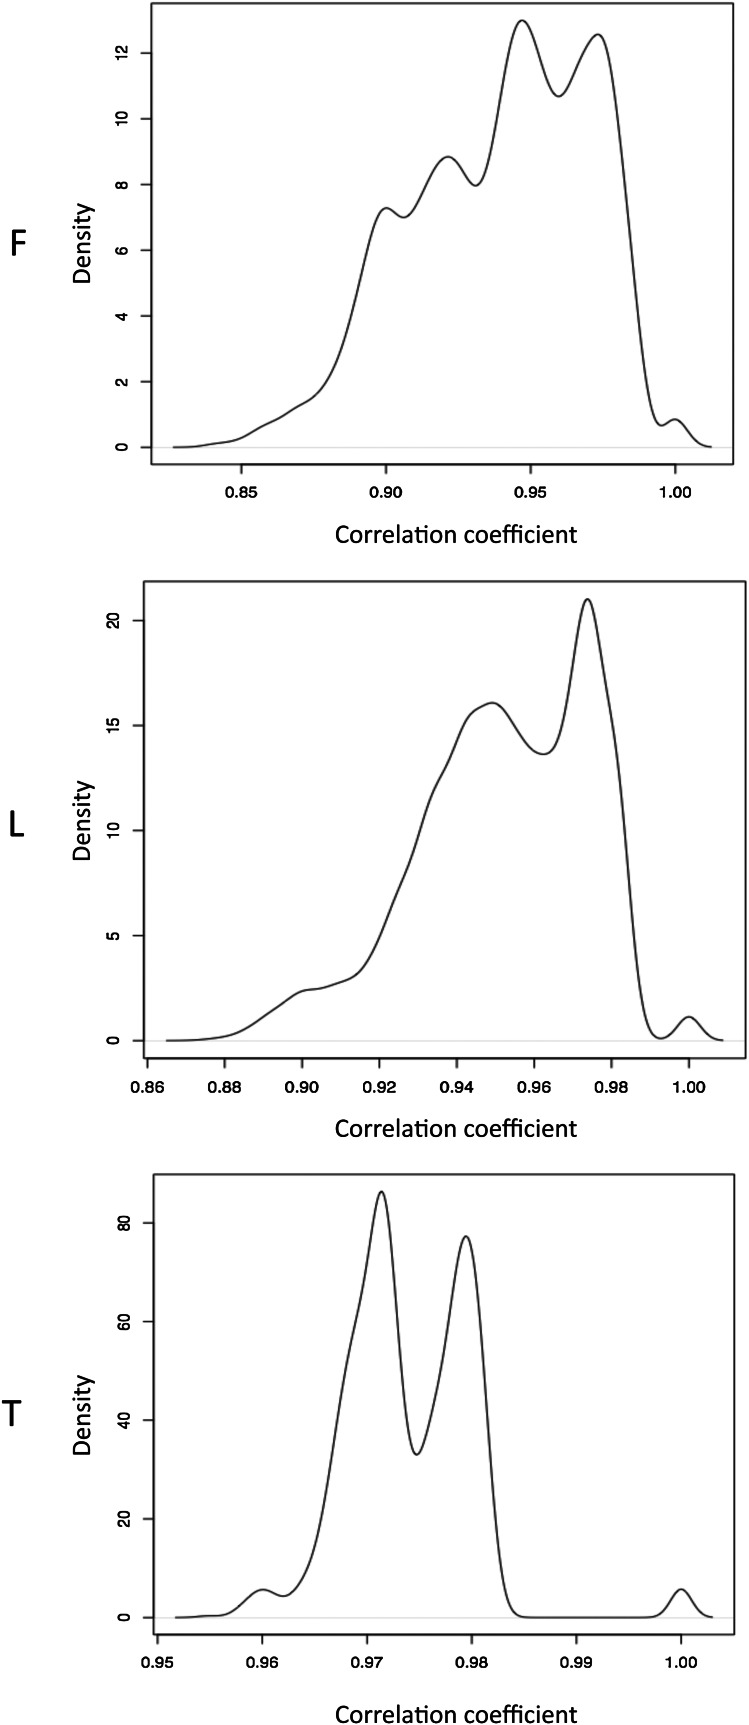
Figure 1—figure supplement 6. Normalized β-value pair wise correlations between individuals.

Figure 1—figure supplement 6.

Distributions of pair wise spearman correlation coefficients between samples in fibroblasts (F), LCLs (L) and T-cells (T).
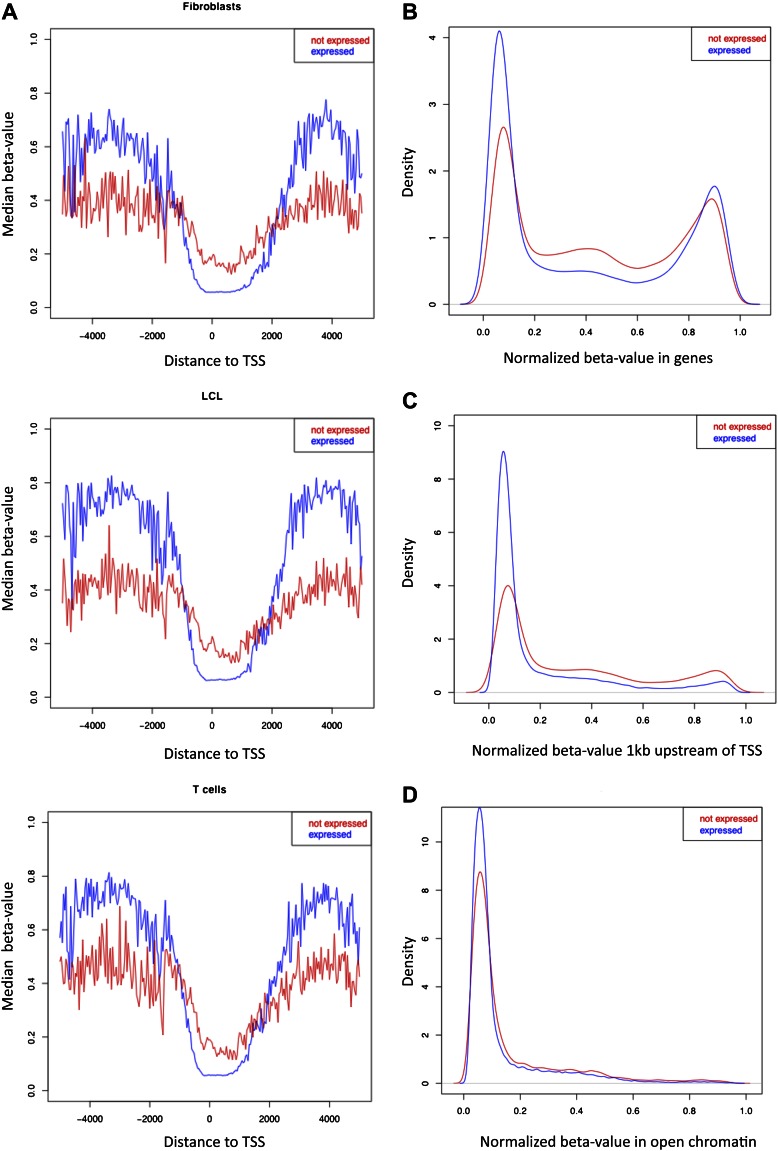
Figure 1—figure supplement 7. β-value distributions in distinct genomic features for expressed and non-expressed genes.

Figure 1—figure supplement 7.

(A) Median β-value across individuals is plotted for CpG sites by their position relative to the nearest transcription start site (TSS) in each cell-type, for expressed (blue) and non-expressed (red) genes. Based on the region where expressed genes have lower methylation levels than non-expressed genes, the promoter proximal region of our analyses was defined from -1kb to +2kb relative to the TSS. (B)–(D) β-value distributions in genes (B), 1kb window upstream of TSS (C) and open-chromatin (D) in one LCL sample for expressed (blue) and non-expressed (red) genes. Other cell-types look very similar.