. 2013 Jun 4;2:e00523. doi: 10.7554/eLife.00523

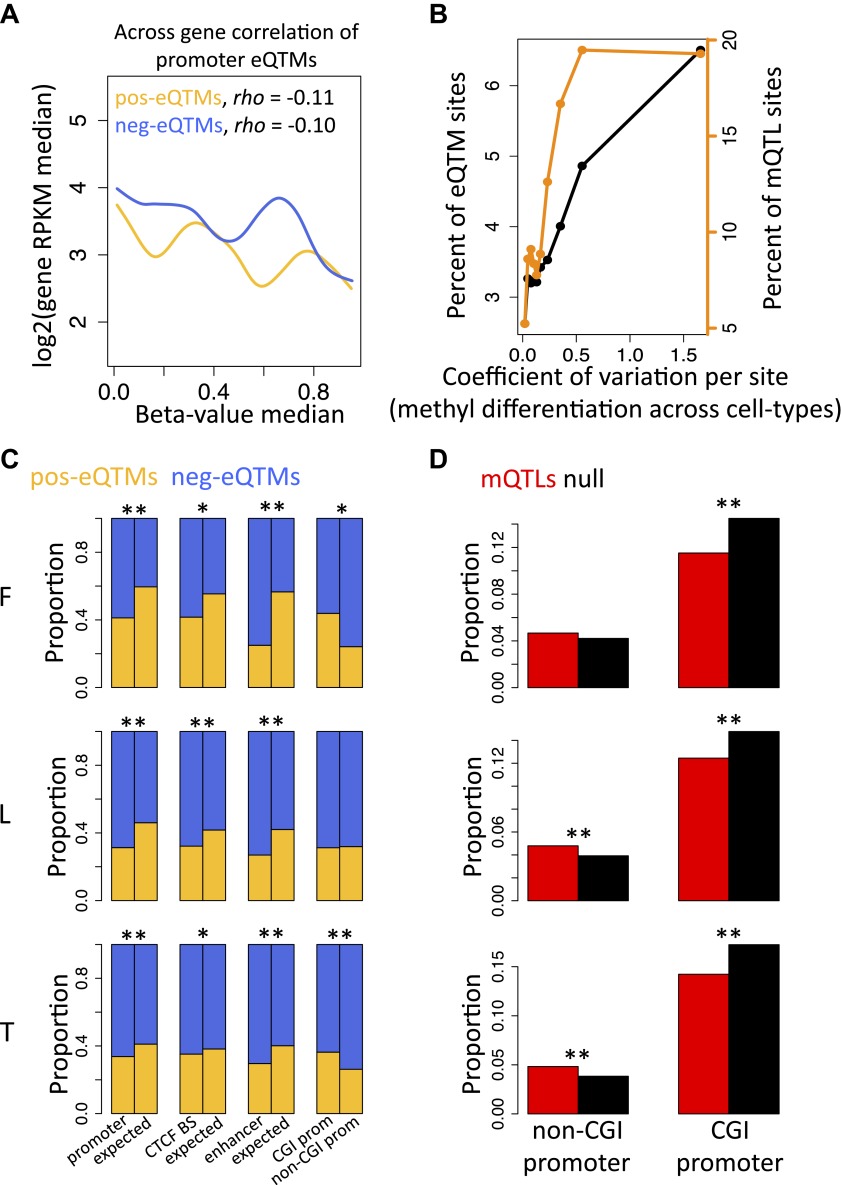
Figure 2. Inter-individual DNA methylation variation in cell-type differentiation and in different genomic contexts.

(A) The median methylation level of promoter eQTM sites (x-axis) correlates negatively with across gene median number of reads per kilobase per million reads (RPKM) irrespective of whether they are pos-eQTMs (yellow, N = 1149) or neg-eQTMs (blue; N = 5112). Spearman correlation coefficient rho is indicated in the plot with p=1.1 × 10⁻⁴ and p=1.7 × 10⁻¹³ for pos and neg-eQTMs, respectively. See Figure 2—figure supplements 1 and 2. (B) As the level of cell-type methylation differentiation increases (x-axis), a larger proportion of sites are associated to gene expression (eQTMs, left y-axis) and affected by genetic variation (mQTLs, right y-axis). Proportions are plotted by 10 bins each containing 10% of the data (0.1 quantiles). Level of methylation differentiation is measured for each site as the coefficient of variation of the median methylation level per cell-type. See Figure 2—figure supplement 3. (C) Proportion of eQTMs that are positive (pos-eQTMs, yellow) or negative (neg-eQTMs, blue) overlapping vs non-overlapping (expected) distinct genomic features (promoters, CTCF binding sites, enhancers), or overlapping CpG island promoters (CGI prom) vs overlapping non-CpG island promoters (non-CGI prom). For T-cells there are no CTCF or chromatin ChIP-seq data available so the data of an LCL were used instead (see Materials and methods). (D) For each non-CGI and CGI promoters (x-axis), the proportion (y-axis) of overlapping mQTLs was calculated (red bars) and was compared to the proportion of overlapping null SNPs (black bars). One star indicates p<0.05, two stars indicate p<1 × 10⁻⁶, Fisher’s exact test.

DOI: http://dx.doi.org/10.7554/eLife.00523.013

Figure 2.

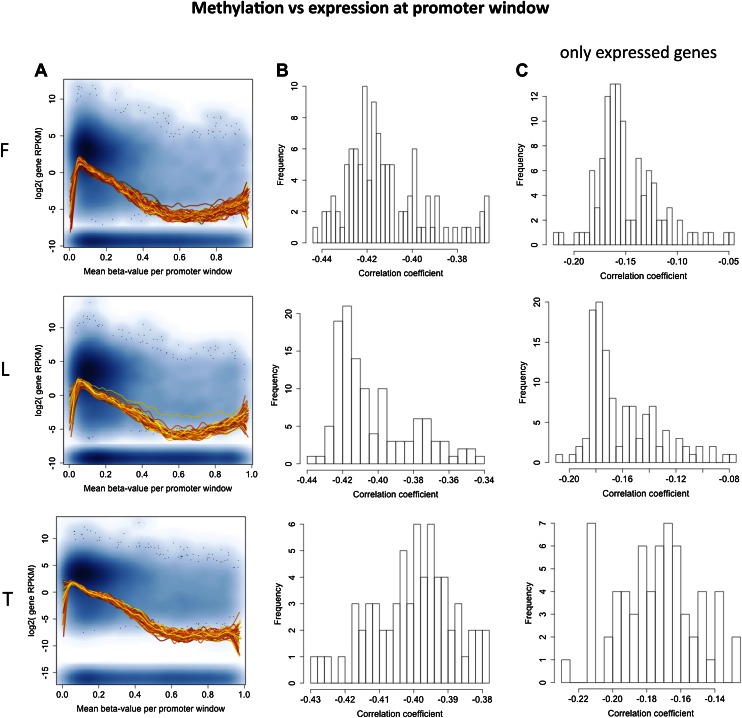
Figure 2—figure supplement 1. Correlation between promoter DNA methylation and across gene expression.

Figure 2—figure supplement 1.

(A) Shown is the median methylation level across all sites falling in the promoter region of a gene (x-axis) by the gene expression level of the gene (y-axis) as the log2 of the median number of reads per kilobase per million reads (RPKM). The background scatter plot represents the data of a single individual, while the fitted lines depict the smoothened mean distribution of values for each individual. Non-expressed genes were artificially plotted at the bottom of the plot. (B) Histogram of Spearman rank correlation coefficients for each sample of correlations explained in (A). All p values<2.2×10⁻¹⁶. (C) Distribution of Spearman rank correlation coefficients for each sample of correlations explained in (A) taking only expressed genes, which were used in our eQTM analyses (at least 1 exonic read in >90% of individuals). In fibroblasts (F) all p values<6.2×10⁻⁸, in LCLs (L) all p values<8.2×10⁻¹⁸, in T-cells (T) all p-values<2.6×10−44.
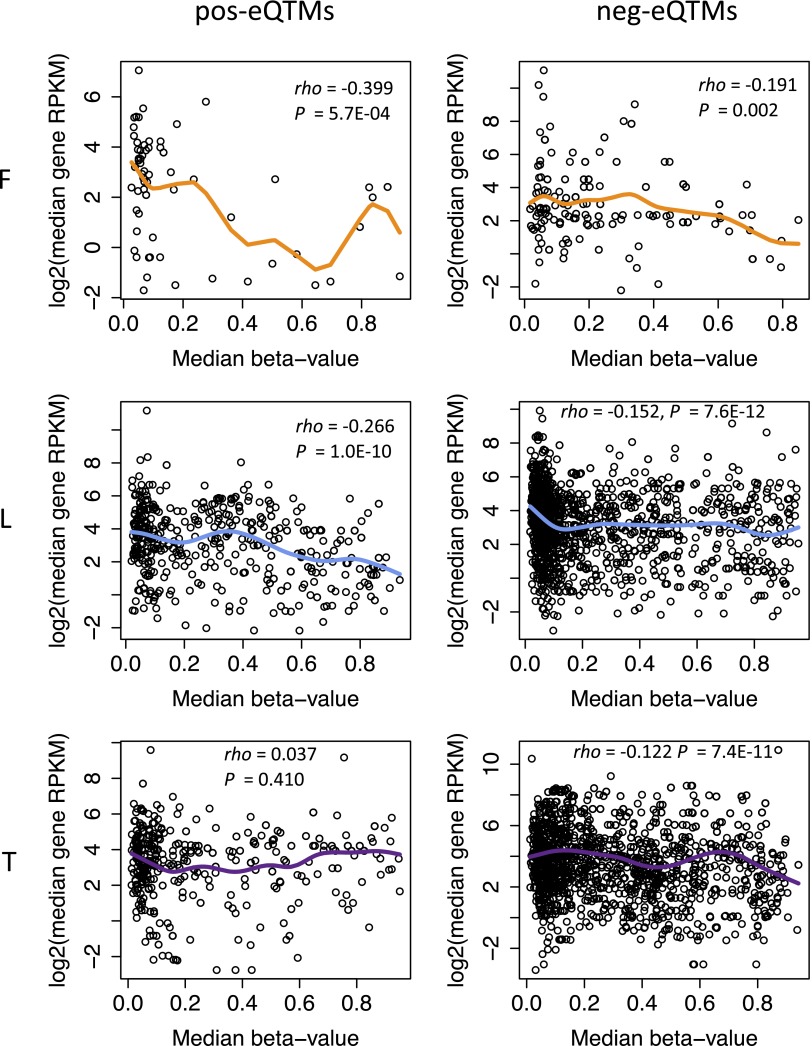
Figure 2—figure supplement 2. pos and neg-eQTMs correlation with across gene expression.

Figure 2—figure supplement 2.

Shown are the correlations between the median methylation levels of eQTM sites (x-axis) and the median gene expression levels (y-axis) for positive-eQTMs (left panels) and negative-eQTMs (right panels) in fibroblasts (F), LCLs (L) and T-cells (T). The Spearman correlation coefficient rho and p value are indicated in each plot. Fitted lines depict the smoothened mean distribution of values.
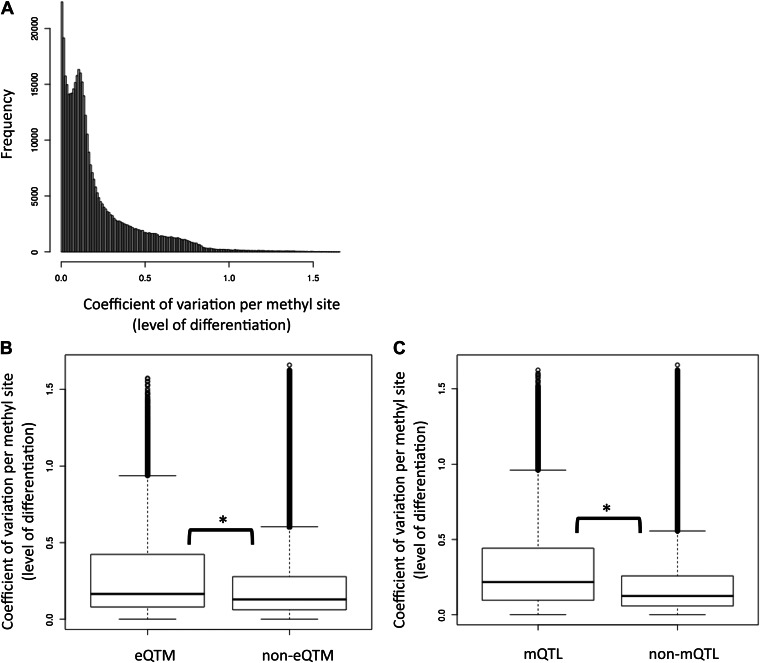
Figure 2—figure supplement 3. Tissue-specific methylation is enriched with eQTMs and mQTLs.

Figure 2—figure supplement 3.

(A) Distribution of the level of differentiation metric which we defined as the coefficient of variation of the median methylation level per cell-type for each site (i.e., standard deviation of the medians divided by the mean of medians). (B) eQTM sites have higher levels of differentiation than non-eQTM sites (C) mQTL sites have higher levels of differentiation than non-mQTL sites. Stars between box plots indicate that the difference is significant with p<2.2×10⁻¹⁶, Wilcoxon test. eQTM and mQTL median methylation levels cover a wide range of β-values, so removing the 113 sites that were below the minimum or above the maximum median (representing effectively unmethylated or fully methylated sites) in all three cell-types did not alter the results at all.