Figure 4. Passive and active roles of DNA methylation in gene regulation.
(A) Illustration of the three possible causative models tested of mechanistic relationships between genetic variation (SNP), DNA methylation (methyl) and gene expression (expr). Arrows indicate the causal direction of effects. The name of each model is underlined. (B) Mosaicplots illustrate the relative likelihoods of each model (x-axis), partitioned by the relative likelihoods of those involving pos-eQTMs (yellow) and neg-eQTMs (blue; y-axis), in fibroblasts (F), LCLs (L) and T-cells (T). The three types of models (INDEP, SME and SEM) are present in the three cell-types, suggesting that DNA methylation can have both active and passive roles in gene regulation. See Figure 4 –figure supplement 1 and Figure 4–Source data 1. (C) Heatmap of p value relative frequency distributions of spearman correlations between transcription factors (TF) and DNA methylation levels of eQTMs at their binding sites, sorted by π1. The enrichment of significant associations can be appreciated by the accumulation of reddish colors, reflecting higher relative frequencies, at low p values, and yellowish colors, reflecting lower relative frequencies, at higher p values. These results highlight one of the possible mechanisms of a passive role of DNA methylation regarding gene expression. See Figure 4—figure supplements 2 and 3.
DOI: http://dx.doi.org/10.7554/eLife.00523.018

Figure 4—figure supplement 1. Passive and active roles of DNA methylation on gene regulation.
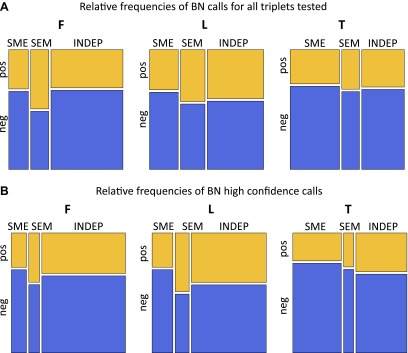
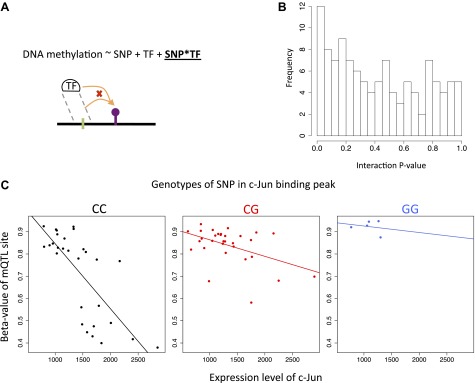
Figure 4—figure supplement 2. Associations between TF abundance and DNA methylation at their target binding sites.

Figure 4—figure supplement 3. Interactions between SNPs and transcription factor levels on DNA methylation.