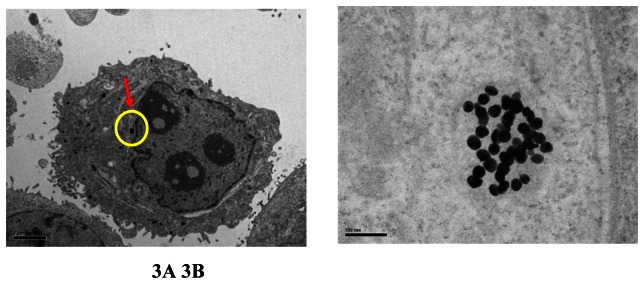
Figure 3.

Transmission electron microscope images of MD-MBA-435S cells treated with GNP for 24 hours. A) The image of the cell (x5000), where the scalar bar is 2 μm, shows the internalization of GNRs by the cell. B) An image of higher magnification (x150000) at the marked location shows the uptake of GNP in cellular vesicle, where the scale bar denotes 100 nm.
