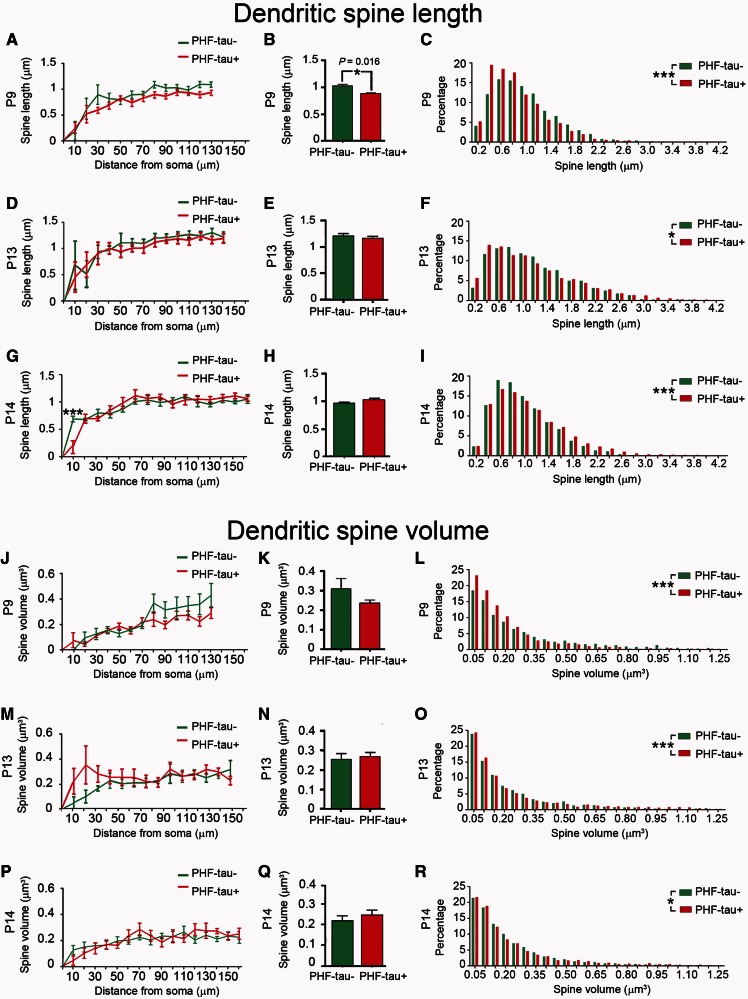
Figure 8.
Morphometric analysis. Comparative morphometric analysis of dendritic spine length (A–I) and dendritic spine volume (J–R) for Lucifer yellow-injected PHF-tau+ pyramidal neurons and Lucifer yellow-injected PHF-tau− neurons from the CA1 of each patient in function of the distance from soma (A, D, G, J, M and P). The average per dendrite (B, E, H, K, N and Q) and the frequency distribution (C, F, I, L, O and R) are shown: *P < 0.05; **P < 0.01; ***P < 0.001.

