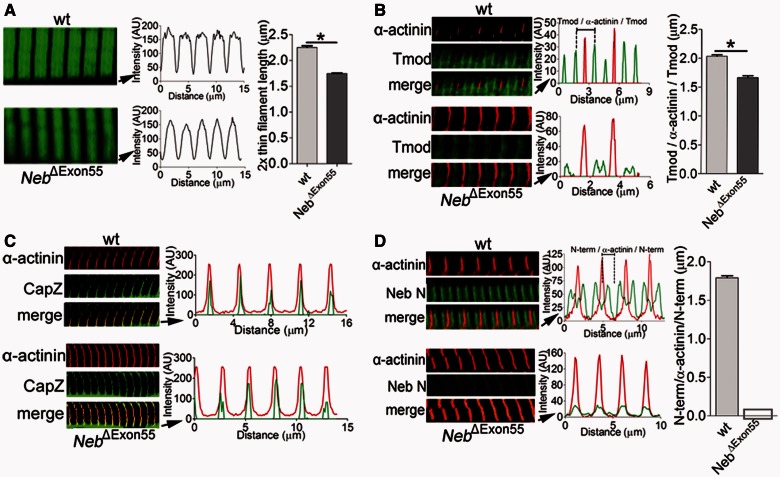
Figure 6.
(A) Left: Actin staining with phalloidin-Alexa Fluor® 488 in Day 6 tibialis cranialis myofibrils from NebΔExon55 and wild-type mice shows broad staining in wild-type myofibrils (top), whereas this staining is narrowed in NebΔExon55 myofibrils (bottom). Right: Analysis of phalloidin line scan intensities revealed significantly reduced average thin filament lengths in NebΔExon55 myofibrils. (B) Left: NebΔExon55 and wild-type myofibrils stained for α-actinin and tropomodulin (Tmod1). Right: Overlay of line scan intensity profile of α-actinin and tropomodulin. The distance between tropomodulin staining (measured across the Z-disk, and indicated as Tmod-α-actinin-Tmod) is significantly reduced in NebΔExon55 myofibrils. (C) CapZ staining of NebΔExon55 and wild-type myofibrils. Staining of NebΔExon55 myofibrils is similar to the staining pattern of wild-type myofibrils. (D) Left: Six day old NebΔExon55 and wild-type myofibrils stained for α-actinin and nebuln’s N-terminus (Neb N). Right: Analysis of line scan intensities. Note that Neb N staining is nearly absent in NebΔExon55 myofibrils. *P < 0.05.

