Figure 8.
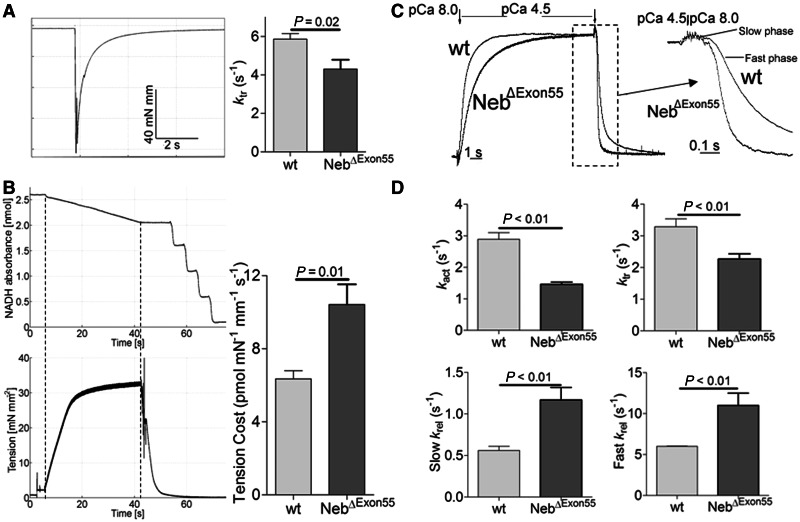
(A) ktr measurements in 6-day-old NebΔExon55 and wild-type (wt) fibres. Left: Example of a ktr protocol in a NebΔExon55 fibre preparation; right: ktr is significantly lower in NebΔExon55 compared with wild-type fibres. (B) Tension cost measurements in NebΔExon55 and wild-type fibres. Left: Example of maximally activated NebΔExon55 fibres with developed force at the bottom and [ATP] at the top. The slope of the [ATP] versus time trace was divided by fibre volume (in mm3) to determine ATP consumption rate. ATP consumption rate was normalized to tension to determine the tension cost. Right: Tension cost is significantly higher in NebΔExon55 compared to wild-type fibres. (C) An example of a protocol to determine crossbridge cycling kinetics in a myofibril. Myofibrils are rapidly activated (pCa 4.5), followed by rapid relaxation (pCa 8.0) after steady state tension is reached. From the force tracings, the rate constants of activation (kact) and relaxation are determined. Relaxation consists of an initial slow phase (slow krel) followed by a fast phase (fast krel). ktr is determined during a separate protocol that is similar to that applied on fibres. (D) Both kact and ktr are significantly lower in NebΔExon55 compared with wild-type myofibrils, whereas slow and fast krel are significantly higher in NebΔExon55 compared with wild-type myofibrils.

