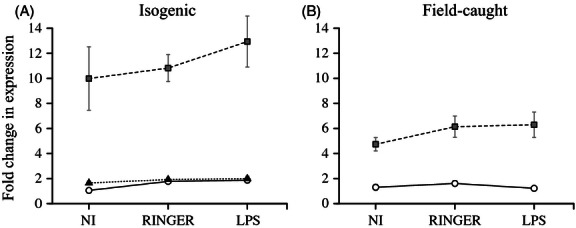
Figure 3.

The effect of insecticide resistance on the esterase-2 gene expression. Gene expression was measured both at its constitutive level (Noninjected: NI) or after injection of Ringer or LPS in both isogenic line (A) and field-caught mosquitoes (B). Symbols represent the mean ± SE change in gene expression compared with the reference (as above). White circles and full lines: insecticide susceptible mosquitoes; gray squares and dashed line: metabolic-resistant mosquitoes; dark triangles and dotted lines: target-site-resistant mosquitoes.
