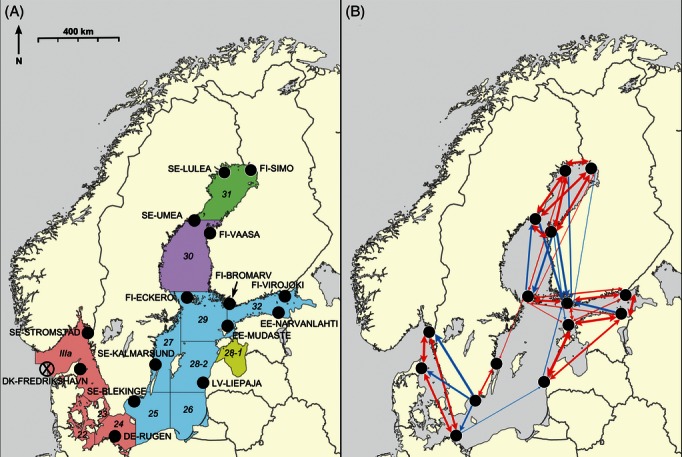
Figure 1.

Map showing (A) the locations of the 15 sampling sites and the existing five herring management units in the Baltic, and (B) connectivities among sites based on oceanographic modelling. The direction of North and an approximate scale are also shown. The numbers and the divisions on the sampling site map indicate the ICES fisheries subdivisions, while the colours in the background denote the different management units. The five management units are: Bothnian Bay (ICES fisheries subdivision SD31), Bothnian Sea (SD30), Baltic Sea (SD25–29 & 32 excluding the Gulf of Riga), Gulf of Riga (SD28.1), and Western Baltic together with spring-spawning herring in Kattegat and Skagerrak (SD22–24 and IIIa). The point used for the ‘entrance to the Baltic’ is shown with a cross in a circle (coordinates 57º06′12.85″N, 08º00′59.28″E). On the connectivity map, the line thickness indicates the relative strength of connectivities on a log-scale. Bi-directional edges (links) are coloured red and indicate that connectivities in both directions were above the threshold, while mono-directional blue edges indicate that connectivities were highly asymmetric between locations with one direction below the threshold.
