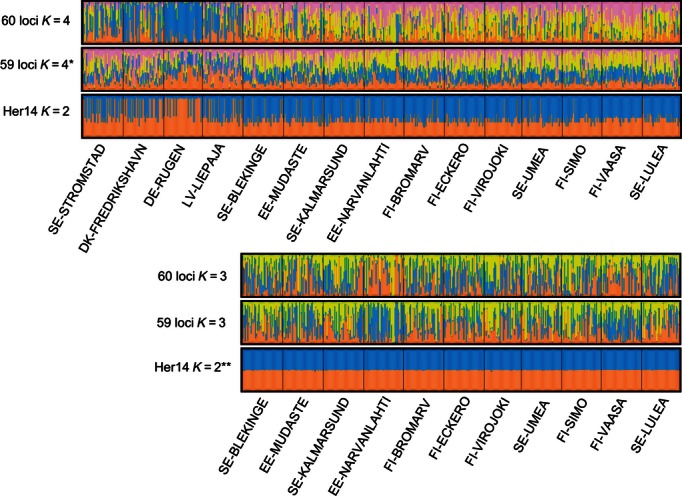
Figure 3.

Bayesian clustering results from Structure. Bar plots are shown for all 60 loci, 59 loci (excluding Her14), and the outlier locus Her14. Plots are shown for the most likely number of clusters for each dataset (delta-K analyses), for all sites (top three plots) and excluding the DE-RUGEN, DK-FREDRIKSHAVEN, SE-STROMSTAD and LV-LIEPAJA cluster (bottom three plots). Within each plot, each vertical bar represents an individual, clusters are indicated by colour, and the y-axis of each plot shows the proportion of the genotype for each individual belonging to each cluster. The plot marked with a star (*) indicates that this analysis failed to converge for the delta-K analysis and so the value of K was instead chosen based on log-likelihood values. The plot marked with two stars (**) indicates that although the mostly likely value of K is 1, it is not possible to assess this possibility using Structure, and so the plot for K = 2 is shown. Probability values below 0.05 are shown in bold.
