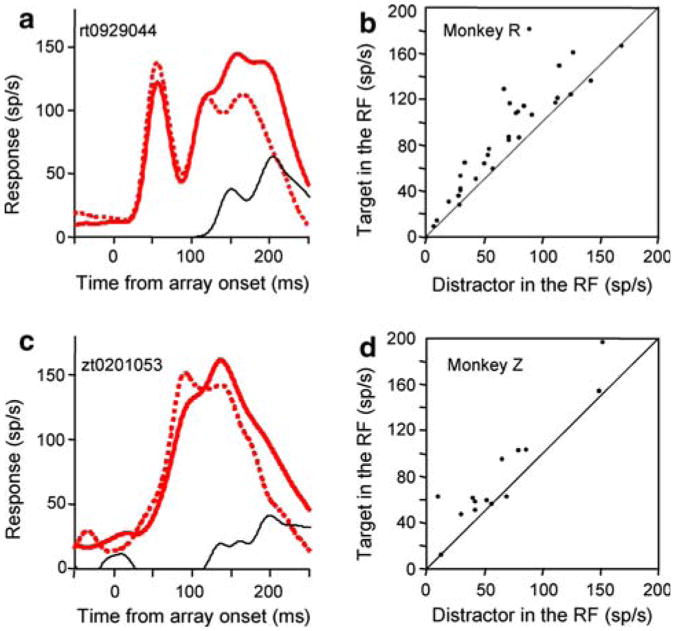
Fig. 4.
The cognitive signal when the monkey made a saccade to the receptive field. a Spike density functions for a single cell from monkey R. The single cell example is from the same cell shown in Fig. 3a. Red trace: target in the receptive field. Dotted red trace: distractor in the receptive field. Black trace: cognitive signal, the difference in the response to the target and distractor. The spike-density functions are aligned with the onset of the array. b Mean activity of each neuron in the interval from 150 to 250 ms after array onset when monkey R made a saccade to a target in the receptive field (ordinate) plotted against the activity in the same interval when the monkey made a saccade to a distractor in the receptive field (abscissa). c, d Same as in a, b for monkey Z. The single cell example is from the same cell shown in Fig. 3c

