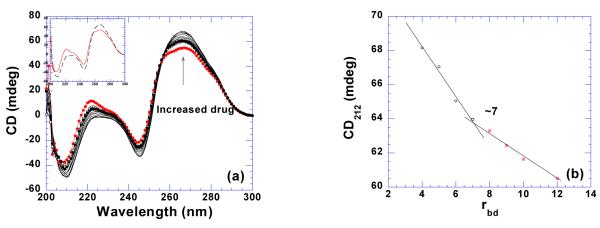
Figure 14.

(a) CD titration of poly(rA)•poly(rU) (75 uM/base pair) with neomycin. The scan with solid circle represents RNA alone. The inset is the CD spectra of RNA alone (continuous line) and ligand-saturated complex (dashed line). (b) A plot of CD signals at 243 nm versus corresponding rbd values for binding site size determination. The experiments were conducted in buffer 10 mM sodium cacodylate, 0.5 mM EDTA, 100 mM NaCl at pH 6.8.
