
Figure 21.
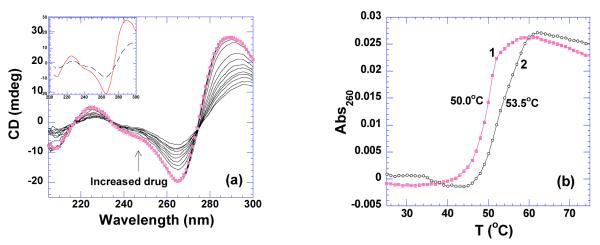
(a) CD titration of neomycin into i-motif DNA(50 uM/base pair). The spectrum with solid circle represents the one of DNA only. The inset shows CD spectra of DNA alone (continuous line) and ligand-saturated complex (dashed line). (b) UV melting profiles of i-motif DNA in the absence (1) and presence (2) neomycin at rbd 4. The experiments were conducted in buffer 10 mM sodium cacodylate, 0.5 mM EDTA, 100 mM NaCl at pH 6.8.