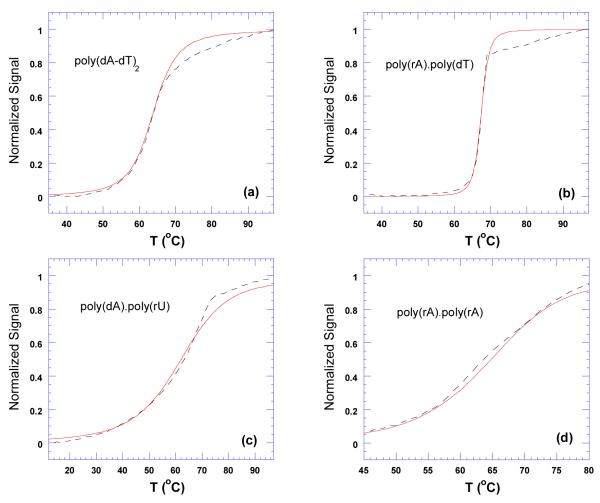
Figure 22.
Thermal denaturation plots for DNA duplexes in the presence of neomycin. The dashed black lines represent thermal denaturation curves from experimental data. The red lines represent best fit simulations derived using McGhee’s statistical mechanical model (109). The corresponding simulated McGhee binding affinity values are as follows; (a) Ka = 2.0×10⁴, (b) Ka = 3.4×10⁵, (c) Ka = 9.4×10⁵, and (d) Ka = 4.7×10⁶. The experiments were conducted in buffer 10 mM sodium cacodylate, 0.5 mM EDTA, 100 mM NaCl at pH 5.5.

