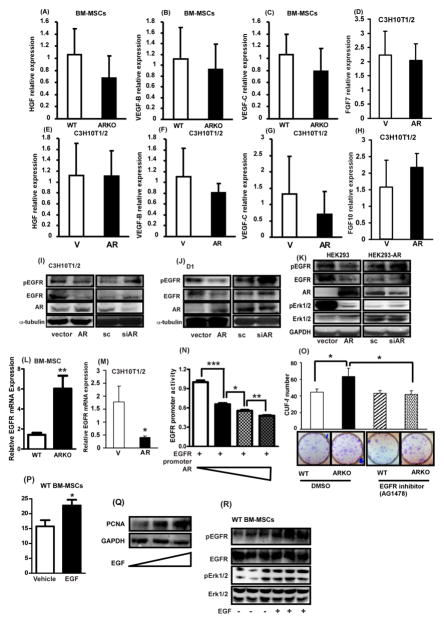
Figure 6. The activation of Akt and Erk signaling in AR knocked out BM-MSCs is through EGF/EGFR.
(A)–(H) qPCR analysis results of HGF, VEGF-B, VEGF-C, KGF, and FGF-10 in primary BM-MSCs and C3H10T1/2 cell line. BM-MSCs were isolated from WT and ARKO mice at ages of 8–12 weeks. (A–C) are the results obtained with primary BM-MSCs isolated from WT and ARKO mice and (D–H) represent the results with C3H10T1/2 cell line after manipulation of AR expression. (I–K) Western blot results in expression levels of EGFR, and p-EGFR in (I) C3H10T1/2, (J) D1, (K) HEK293 cell lines after manipulation of AR expressions. (L, M) qPCR analysis results of EGFR in (L) primary BM-MSCs of WT and ARKO mice and (M) C3H10T1/2 cell line after AR overexpression. (N) EGFR promoter assay was performed in HEK-293T cells. From lanes 1 to 4, AR was increasingly added to the experimental set as drawn in the image. (O) CFU-f test result of BM-MSCs of WT and ARKO mice after treatment with EGFR inhibitor (AG1478, 0.5 μM). (P) 20 ng/ml EGF was used to treat WT BM-MSCs to see EGF effect on the CFU-f and (Q) pEGFR, EGFR, pErk1/2, and pErk1/2 were measured using western blot. *, p-value < 0.05, **, p-value < 0.01, when compared with control.

