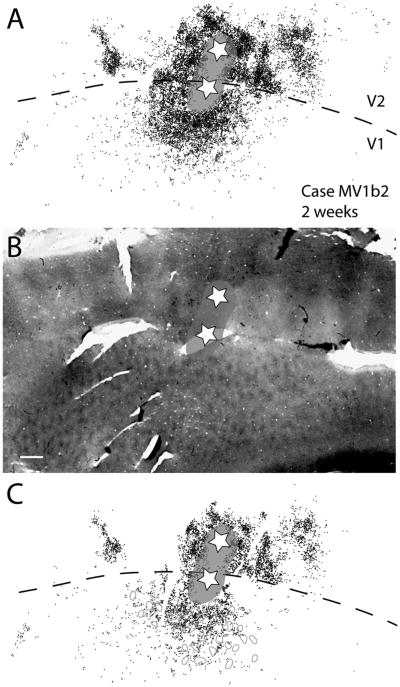
Figure 13.
Case MV1b2. A: Reconstruction of retrogradely labeled cells after two closely spaced CTB injections along the V1/V2 border in a 2-week-old macaque. The two stars represent the injection locations. One injection site is more in V1, whereas the second injection site is more in V2 (the stripe type is uncertain). The gray halo represents the tracer spread, which continues from one injection site to the other across the V1/V2 border. This reconstruction was made by merging three CTB sections together. B: Photomicrograph of a cytochrome oxidase stain with the injection site locations and tracer spread superimposed on top. C: A single middle CBT section from the three CTB sections shown in A. Close to the injection site in V1, the label is quite dense; however, further away from the injection site the label is somewhat patchy. For abbreviations, see list. Scale bar = 1 mm in B (applies to A–C).

