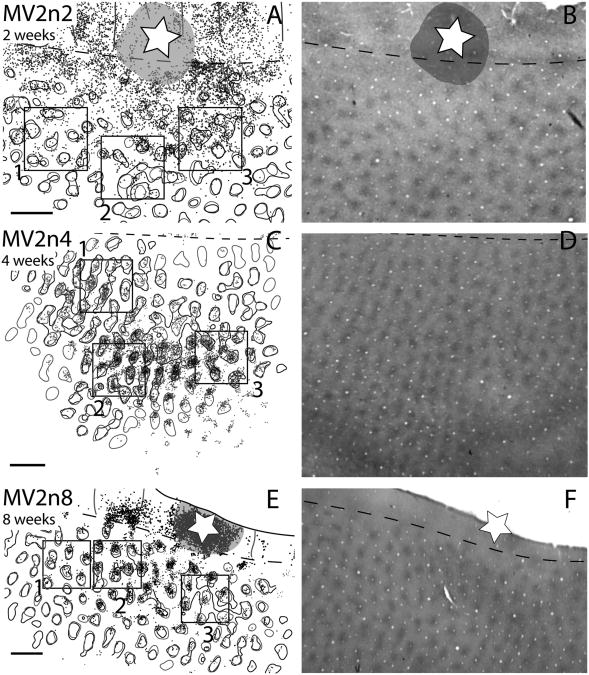
Figure 5.
V1 blob and interblob cell locations after injections in thin stripes for 2-, 4-, and 8-week-old macaques. A,C,E: Close-up views of V1 from Figures 2, 3, and 4. B,D,E: The corresponding photomicrographs of V1 blob patterns expressed with cytochrome oxidase staining for A, C, and E, respectively. Gray circles indicate the blob borders determined with visual inspection, and black circles represent blob borders determined with computer filtering. Scale bar = 1 mm in A (applies to A,B), C (applies to C,D), and E (applies to E,F).

