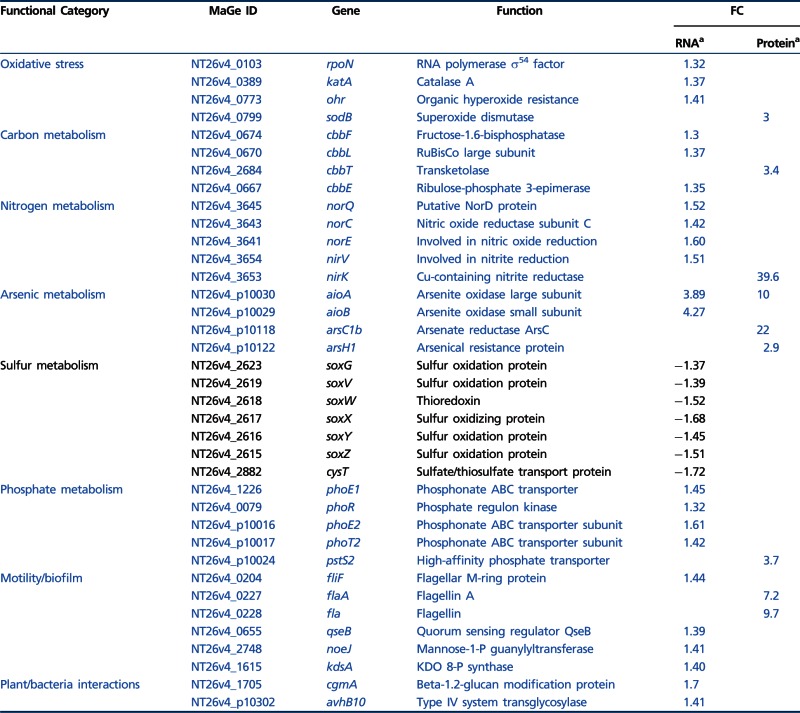
Table 1.
Major Arsenic-Regulated Functional Categories Identified in Transcriptomics and Proteomics Experiments
 |
Note.—Induced and repressed functions are shown in blue and black, respectively. No value is indicated in the FC column if the gene is not statistically differentially expressed in transcriptomics or if the protein has not been identified in proteomics. Complete data are presented in supplementary table S6, Supplementary Material online.
aFold-change observed in transcriptomics and proteomics data, respectively.
