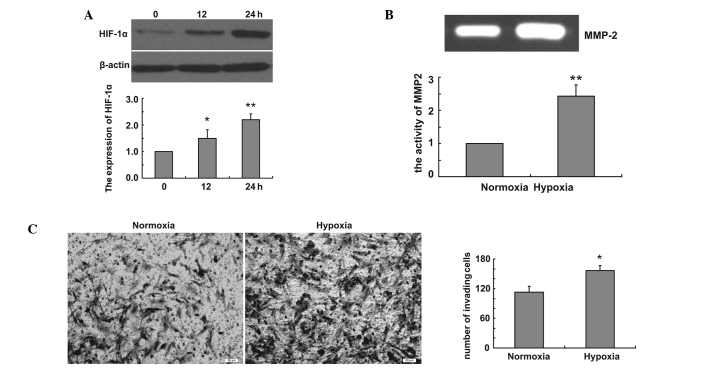
Figure 1.
Hypoxia increases glioma cell invasion and MMP2 activity. (A) Western blot analysis shows the time-dependent effect of hypoxia on levels of HIF-1α in U251 cells. The bar graph shows relative expression of HIF-1α in hypoxia-treated cells versus those in control cells (*P<0.05, **P<0.01). (B) U251cells were incubated under normoxic or hypoxic conditions for 24 h and cell culture medium samples were collected. Gelatin zymography assays show the effect of hypoxia on enzymatic activity of MMP2. The bar graph shows the relative integrated densities of the bands in hypoxia-treated cells versus those in control cells (**P<0.01). (C) U251 cells were incubated in a Transwell chamber under normoxic or hypoxic conditions for 24 h, and the cells were stained with Coomassie Brilliant Blue. The bar graph shows mean number of migrated cells (*P<0.05).

