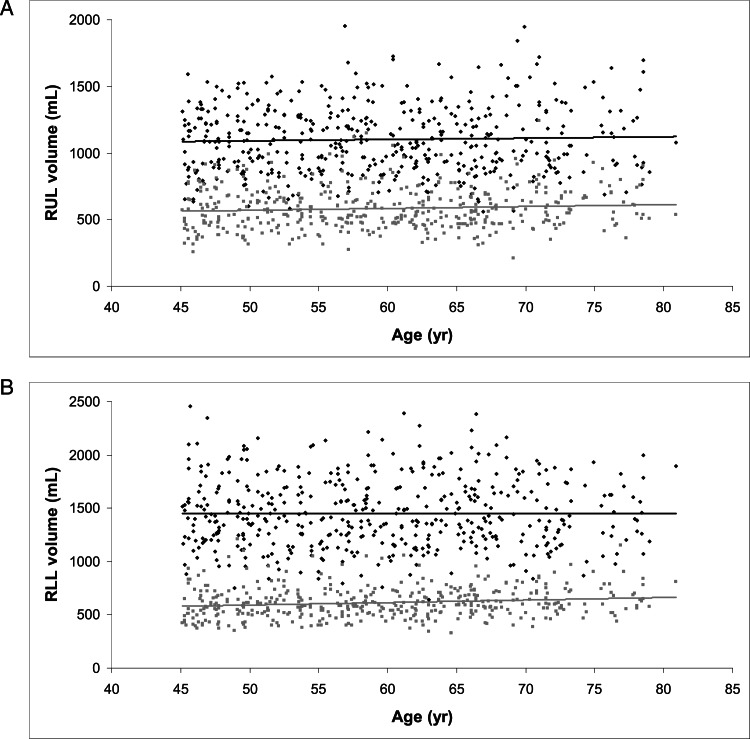
Figure 2.
A, Relationship between age and RUL volume at TLC (■, β=1.01, P = .43) and FRC (gray squares, β=1.42, P = .09). B, Relationship between age and RLL volume at TLC (■, β=0.11, P = .95) and FRC (gray squares, β=2.35, P = .002). FRC = functional residual capacity; RLL = right lower lobe; RUL = right upper lobe. See Figure 1 legend for expansion of other abbreviation.

