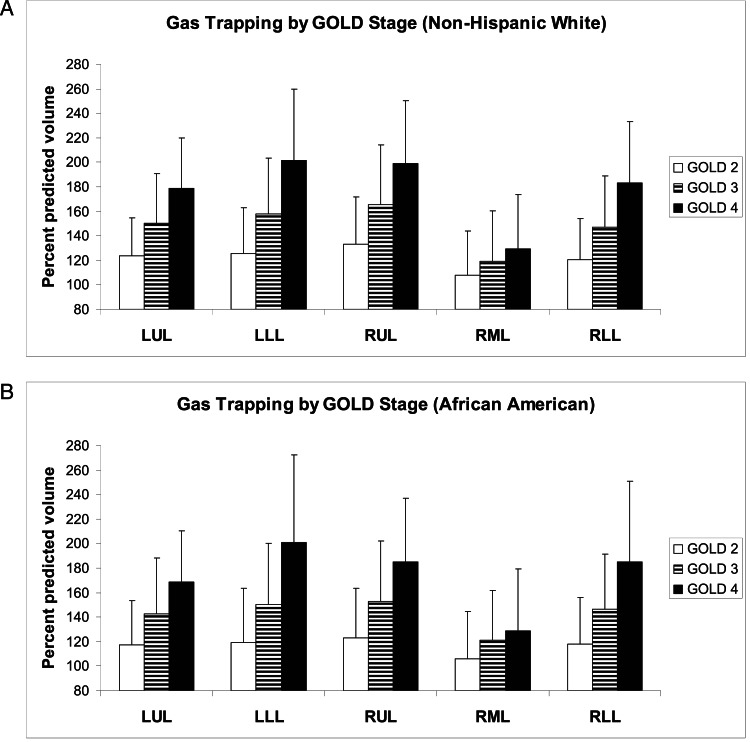
Figure 6.
A, Lobar gas trapping ([CT scan-measured lobar volume/predicted lobar volume at FRC] × 100) by GOLD stage for NHW subjects. B, Lobar gas trapping by GOLD stage for AA subjects. For both races, there is progressive gas trapping with increasing airflow obstruction, and even GOLD II subjects have significant gas trapping. Data are presented as means and SDs. See Figure 1 legend for expansion of abbreviations.

