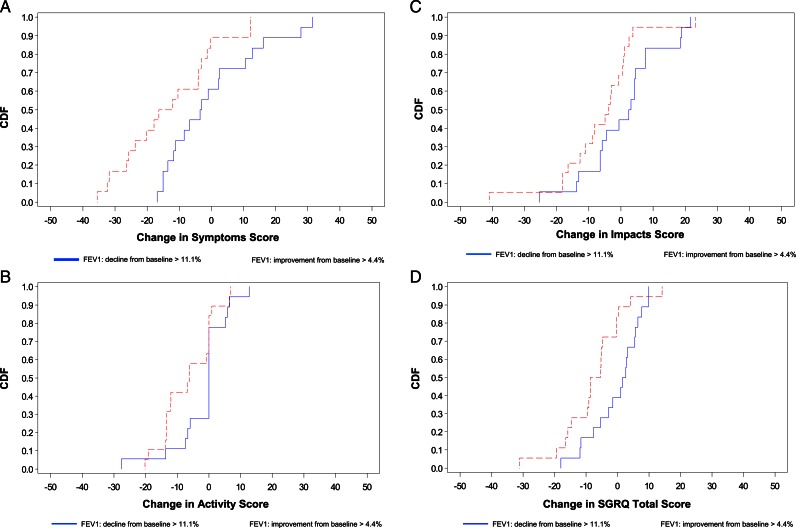
Figure 1.
A, Plot of CDF for the two extreme quartiles of change from baseline in FEV1 for SGRQ Symptoms domain. B, Plot of CDF for the two extreme quartiles of change from baseline in FEV1 for SGRQ Activity domain. C, Plot of CDF for the two extreme quartiles of change from baseline in FEV1 for SGRQ Impacts domain. D, Plot of CDF for the two extreme quartiles of change from baseline in FEV1 for SGRQ total score. CDF = cumulative distribution function; SGRQ = St. George’s Respiratory Questionnaire.

