
Figure 1.
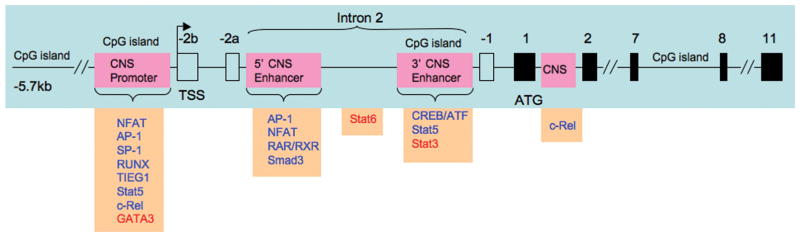
Structure of the murine Foxp3 gene. Locations of CNS (conserved non-coding sequences) in the promoter and intron 2 are shown in pink; the 5′ and 3′ CNS in intron 2 serve as enhancer sites. Location of CpG islands are also shown; these islands exhibit demethylation in the active gene. Transcription factors binding to the promoter and enhancer sites shown in orange boxes; positive factors shown in blue; negative factors shown in red. See text for further details.