
Figure 4.
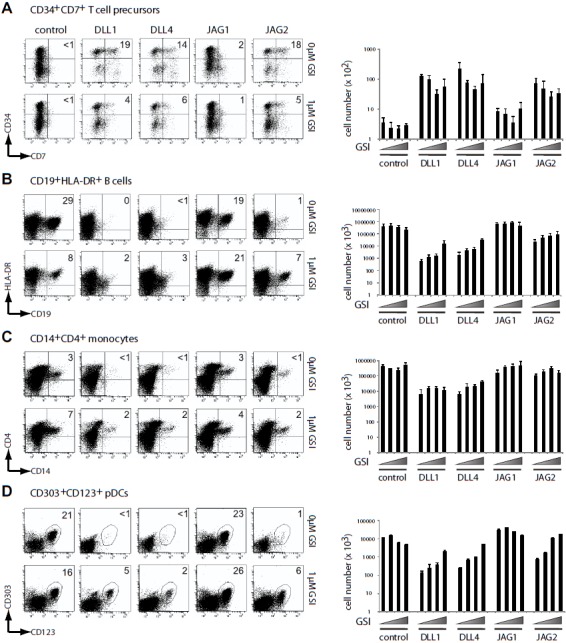
Dose-dependent Notch inhibition reveals a signal strength hierarchy. Effects of dose-dependent Notch inhibition on the induction of T-lineage differentiation (A), B-cell development (B), monocyte development (C), and plasmacytoid differentiation (pDC; D). Left panels: Flow cytometric analysis of human CD34+CD38−lin− CB HPCs after OP9 coculture in the presence of 0 or 1μM GSI (7 N-[N-(3,5-difluorophenyl-L-alanyl]-S-phenylglycine t-butyl ester). Numbers in quadrants indicate the percentage of CD34+CD7+ T-cell precursors (A), CD19+HLA-DR+ B cells (B), CD14+CD4+ monocytes (C), and CD123+CD303+ pDCs (D). Results shown are representative of 3 independent experiments. Right panels: Corresponding average of the absolute number of CD34+CD7+ T-cell precursors (A), CD19+HLA-DR+ B cells (B), CD14+CD4+ monocytes (C), and CD123+CD303+ pDCs (D) for cultures depicted in the corresponding left panel. Error bars represent SEM.  indicates an increasing dosage of GSI, corresponding to 0, 0.1, 0.3, and 1μM GSI.