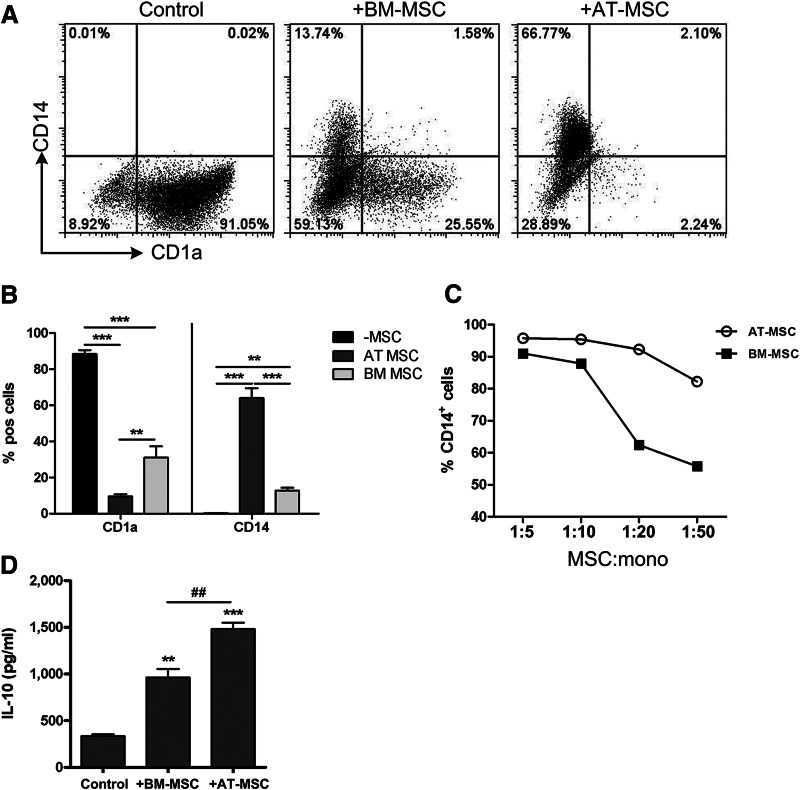
Figure 4.
AT-MSCs are more potent inhibitors of monocyte differentiation than BM-MSCs. (A): Representative dot plots of monocyte differentiation toward immature dendritic cells in the absence and presence of BM-MSCs and AT-MSCs (MSC:monocyte ratio of 1:10). (B): Cumulative data of CD1a and CD14 expression on differentiated monocytes. Data are means from three different BM-MSCs and three different AT-MSCs (MSC:monocyte ratio of 1:10); statistical analysis was performed using Student's t test (*, p < .05; **, p < .01; ***, p < .001). (C): Dose-response curves of the percentage of CD14+ cells in the presence of BM-MSCs (■) or AT-MSCs (○). (D): IL-10 concentrations in culture supernatants from day 6 of the monocyte differentiation in the presence of BM-MSCs and AT-MSCs are increased compared with the differentiation without MSCs. Data are means from three different experiments with six different BM-MSCs and three different AT-MSCs (MSC:monocyte ratio of 1:10); statistical analysis was performed using Student's t test (* indicates compared with control: **, p < .01; ***, p < .001; # indicates BM-MSCs compared with AT-MSCs: ##, p < .01). Abbreviations: AT-MSC, adipose tissue-derived multipotent stromal cells; BM-MSC, bone marrow-derived multipotent stromal cells; IL, interleukin; mono, monocyte; MSC, multipotent stromal cells; pos, positive.

