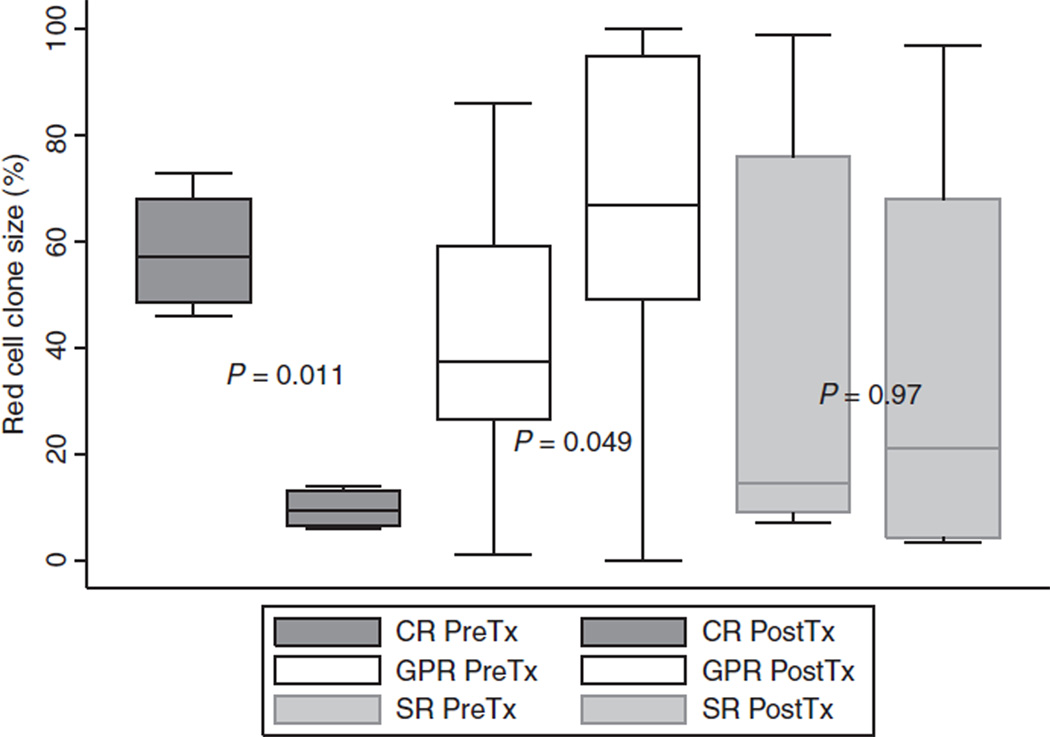
Figure 2.
Comparison of red cell clone size pre- and post-treatment with eculizumap between complete responders, good partial responders, and suboptimal responders. A boxplot representation of the median and interquartile ranges of the clones size of the patients in each response category. CR, complete response; GPR, good partial response; SR, suboptimal response; tx, treatment.

