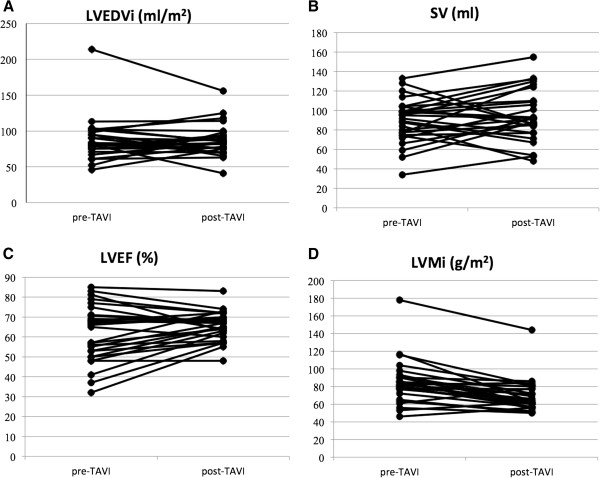
Figure 4.
Changes in CMR endpoints from baseline to follow up. LVEDVi (87.2±30.1 ml /m2vs 86.4±22.3 ml/m2; p = 0.84), SV (89.2±22 ml vs 94.7 ml ±26.5; p = 0.25) and LVEF (61.5±14.5% vs 65.1±7.2%, p = 0.08), did not change significantly (Panel A, B, C). LVMi decreased from 84.5±25.2 g/m2 at baseline to 69.4±18.4 g/m2 at six months follow-up (p < 0.001) (Panel D).

