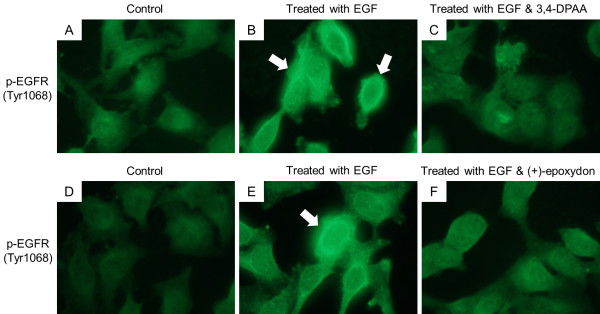
Figure 7.

Immunofluorescence of the expressions of phosphorylated EGFR. Immunofluorescence was performed as follows by Materials and Methods and the images were captured at 488 nm. In control cells (panels A and D) and cells treated with EGF (10 ng/mL for 10 min, panels B and E), EGF induced the expression of active EGFR (white arrows, brightened) but the increased expression levels were not decreased in the cells treated with both EGF and each compound (panels C and F).
