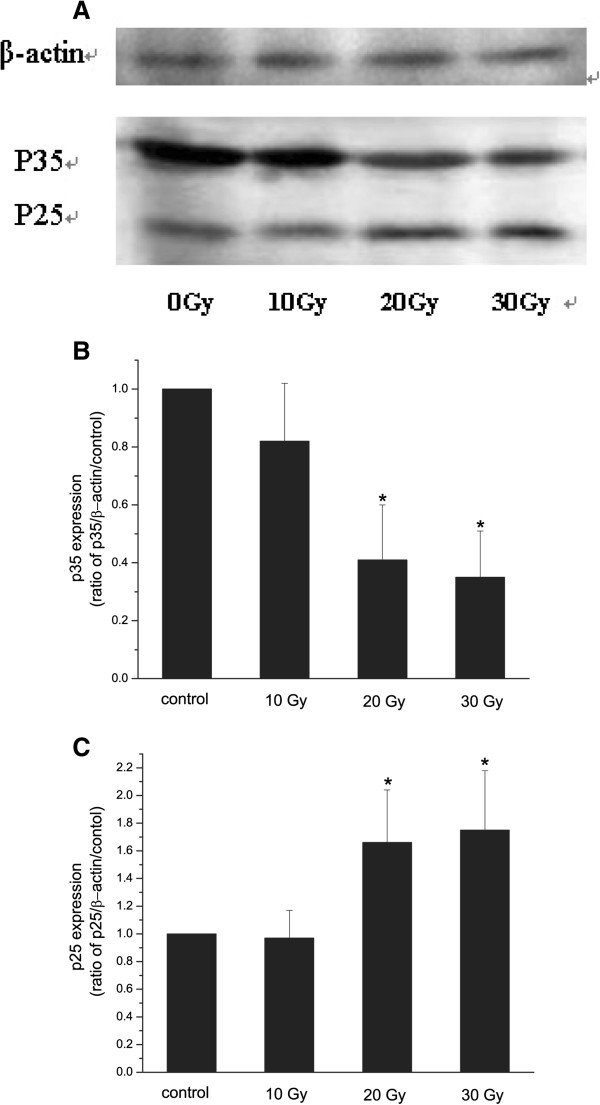
Figure 2.
A-C Western blot analysis of p35 and p25 expression in rats after irradiation. Representative Western blot showing the expression of p35 and p25 in rat hippocampi. Lane 1, sham-irradiation; lane 2, 10 Gy irradiation; lane 3, 20 Gy irradiation; lane 4, 30 Gy irradiation (A). Quantitative Western blot analysis of p35 (B) and p25 (C) expression in rats with sham-irradiation. β-actin was a loading control. n=3. *p<0.05 vs. control.

