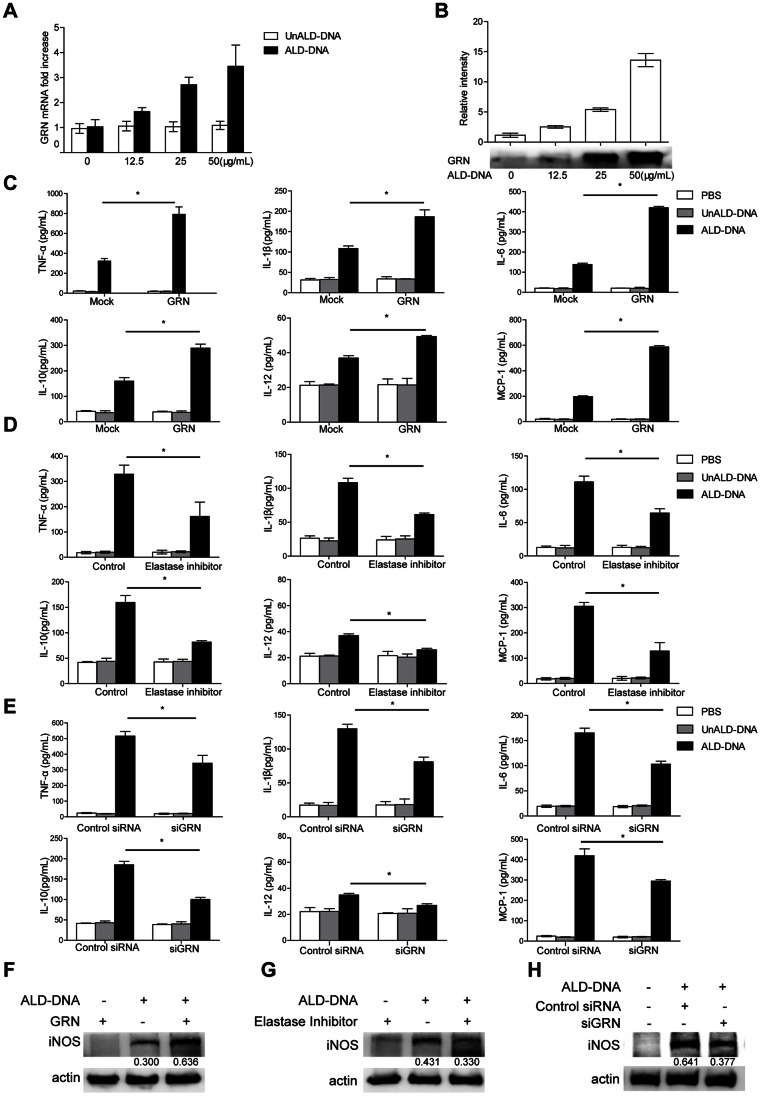
Figure 4. GRN played a pivotal role in the ALD-DNA-induced M2b polarization in vitro.
(A–B) Primary macrophages were stimulated with increasing amounts of ALD-DNA for 24 h. mRNA levels of GRN in macrophages were analyzed by real time PCR analysis (A), and protein levels of GRN in the supernatants of macrophages were analyzed by western blot (B). Above, quantitative results of western blots, the band intensity was measured by Image J; Below, representative western blots. Similar results were obtained in three independent experiments. Data are representative of results obtained in three independent experiments. Primary peritoneal macrophages were stimulated by ALD-DNA (50 µg/mL) with GRN (5 µg/mL) for 24 h (C and F), or were pretreated with elastase inhibitor (100 µM) or DMSO (0.1%) for 12 h (D and G), and then were exposed to ALD-DNA, UnALD-DNA, or PBS for another 24 h. Macrophages were transfected with control siRNA (200 nM) or GRN siRNA (siGRN, 200 nM). 36 h posttransfection, macrophages were stimulated with PBS, UnALD-DNA or ALD-DNA (50 µg/mL) (E and H). (C–E) ELISA assay was used to analyze the levels of TNF-α, IL-1β, IL-6, IL-10, IL-12, and MCP-1 in the culture supernatants of macrophages. Data are means ± SD of three independent experiments. (F–H) Western blot analysis was used to analyze the protein levels of iNOS in macrophages. Data are representative of three separate experiments. Similar results were obtained in three independent experiments. Band intensity was measured by Image J and the ratios of iNOS to β-actin were calculated. *, P<0.05.

