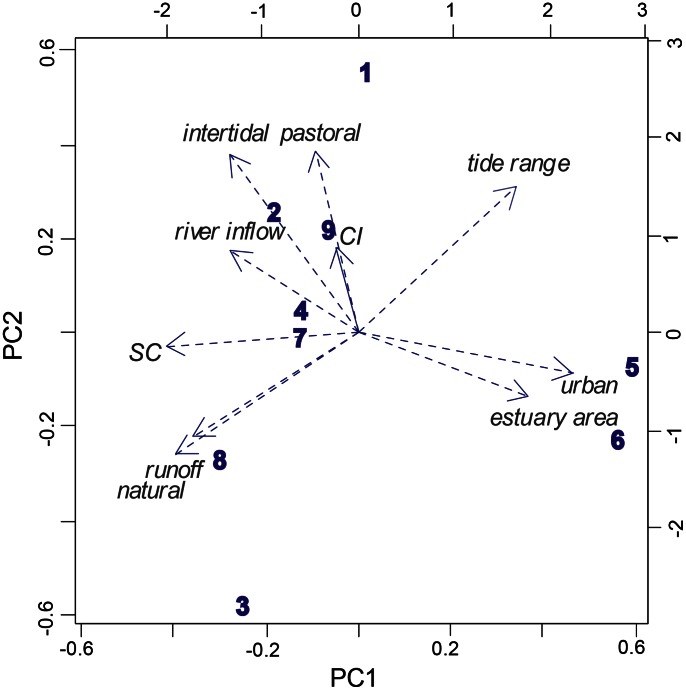
Figure 2. Principal Components of the estuarine and catchment environment data (arrows; data from Table 1) at each estuary: 1, Mangemangeroa; 2, Okura; 3, Parekura; 4, Puhoi; 5, Tamaki; 6, Waitemata; 7, Waiwera; 8, Whananaki; 9, Whangateau.
PC1∶41% and PC2∶22% of explained variance.

