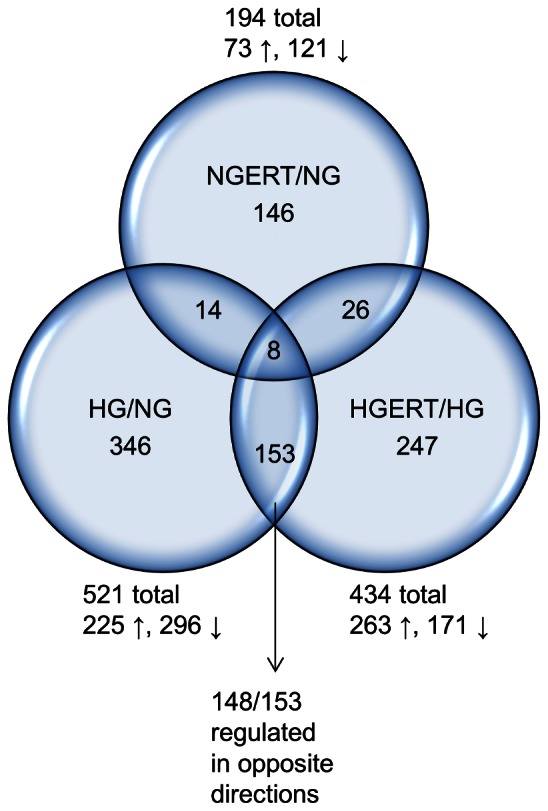
Figure 5. Venn diagram of changed transcripts.

Venn diagram showing the overlap of differentially expressed transcripts after pre/co incubation with or without 5 mM erythritol (ERT) of HUVECs cultured in normal glucose (NG, 7 mM) or high glucose (HG, 30 mM) for 24 hours. Changed transcripts of the following comparisons are shown: HGERT vs HG (HGERT/HG); NGERT vs NG (NGERT/NG) and HG vs NG (HG/NG).
