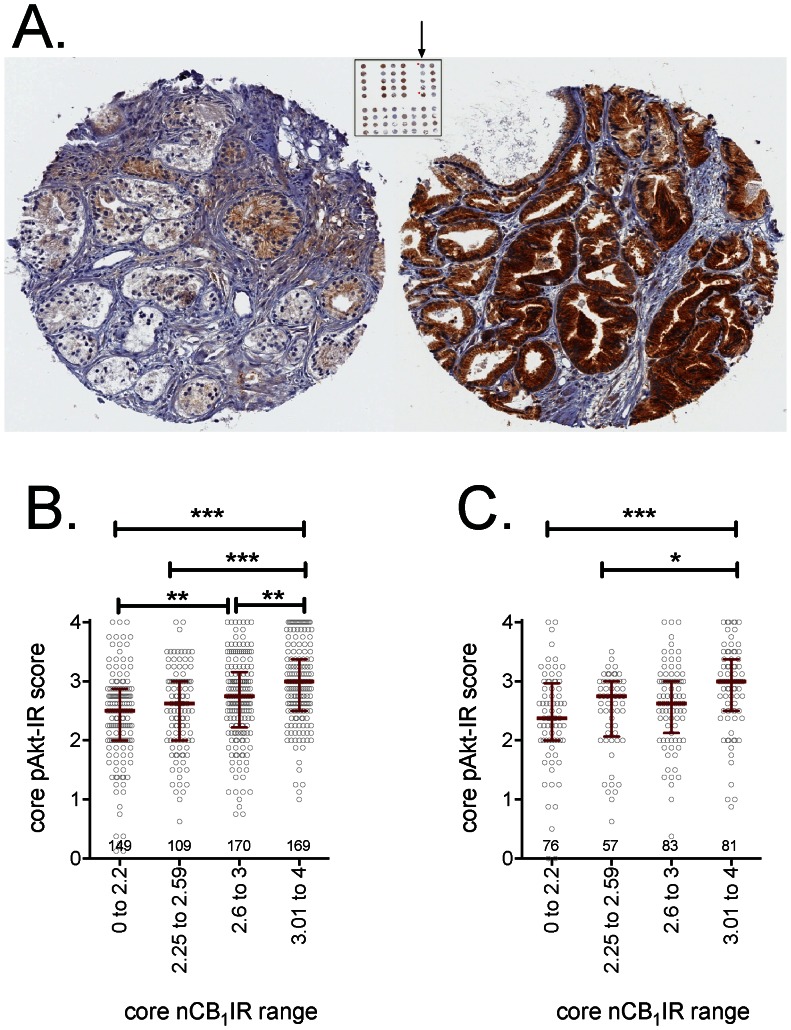
Figure 1. Tumour nCB1IR: variation with pAkt-IR.
Panel A shows two tumour cores from the same case (Gleason score 7) showing a large variation in the CB1IR intensity. They had positions 1 and 5 of the tumour series arrowed. The left core was scored 0.75 (50% score 0, 25% score 1, 25% score 2) by one investigator, and 1 (25% score 0, 50% score 1, 25% score 2) by the other. The right core was scored 2.75 by both investigators (50% score 2, 25% score 3, 25% score 4 by one investigator; 25% score 2, 75% score 3 by the other investigator). Panel B and C show the pAkt scores for individual cores in the test (n = 595, Panel B) and validation (n = 297, Panel C) datasets, divided into approximate nCB1IR quadrants. The number of cases in each quadrant is shown in the graph, together with the median and interquartile ranges. *P<0.05, **P<0.01, ***P<0.001 for the comparisons shown, otherwise not significant (Dunn's multiple comparison test following significant (P<0.0001) Kruskal-Wallis test. The spearman's rho for correlations between the core nCB1IR and the core pAkt-IR were 0.29 and 0.28 (both P<0.0001) for the test and validation sets, respectively.

