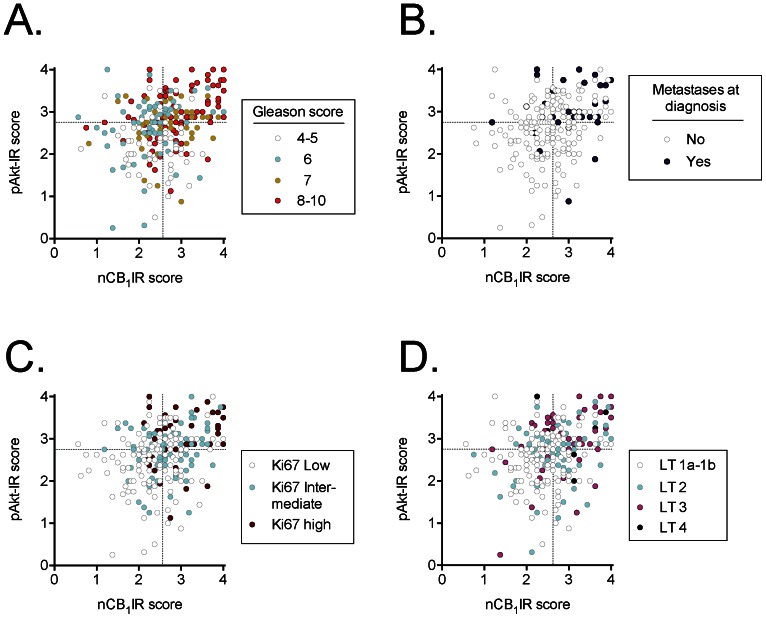
Figure 2. Scatter plots of cases scored for tumour nCB1IR (abscissae) and pAkt-IR (ordinates) and sorted on the basis of A, Gleason score (GS); B, absence or presence of metastases at diagnosis; C, Ki-67 index; D, tumour grade (LT).
The Ki67 index is a continuous variable ranging from 0–48% in the dataset [34]. The tranches were chosen here for illustrative purposes but represent the bottom 50% (“Ki67 Low”), the 50–75% (“Ki67 intermediate”) and the top 25% (“Ki67 high”). The dotted lines in the figures show the median scores for nCB1IR and pAkt-IR for the dataset.

